About the Tool
Opposite thinking is a tool that helps teams arrive at creative ideas by looking at a problem or situation from a new perspective. This tool is a great brainstorming technique for thinking outside the box. It can stimulate creativity, enhance problem-solving, and provide a fresh perspective on challenges.
Opposite thinking is helpful when launching a new initiative or attempting to resolve a complex problem. By examining situations from a different angle, the tool helps identify hidden assumptions or aspects that may have been overlooked. Opposite thinking also enhances learning from experiences by extracting valuable lessons that can guide future approaches to similar situations. Anyone looking to improve their problem-solving abilities or creative thinking can benefit from using opposite thinking tools. This way of thinking encourages stepping out of comfort zones to explore unconventional solutions and make more well-rounded decisions.
Purpose: Ideation
Estimated Time Needed: 30 minutes
Target Participants or Users: Change Managers, Program Managers, Operations Managers, Planning Officers, Policymakers, Service Designers
How to Use the Tool
Steps:
- Identify the problem or challenge.
- Write assumptions related to the challenge you are trying to solve. These assumptions could be about current customers’ beliefs, behaviors, needs, preferences, technology limitations, and the context in which they interact with a product or service.
- For each assumption, write an opposite statement. These opposite statements can be a minor change, a removal of a specific element, an exaggeration of elements or the whole situation, or the total opposite of the situation. Think about the opposite statements you have written and how they affect the problem or challenge.
- In the third column, write potential solutions for these opposite statements.
- Review all the proposed solutions.
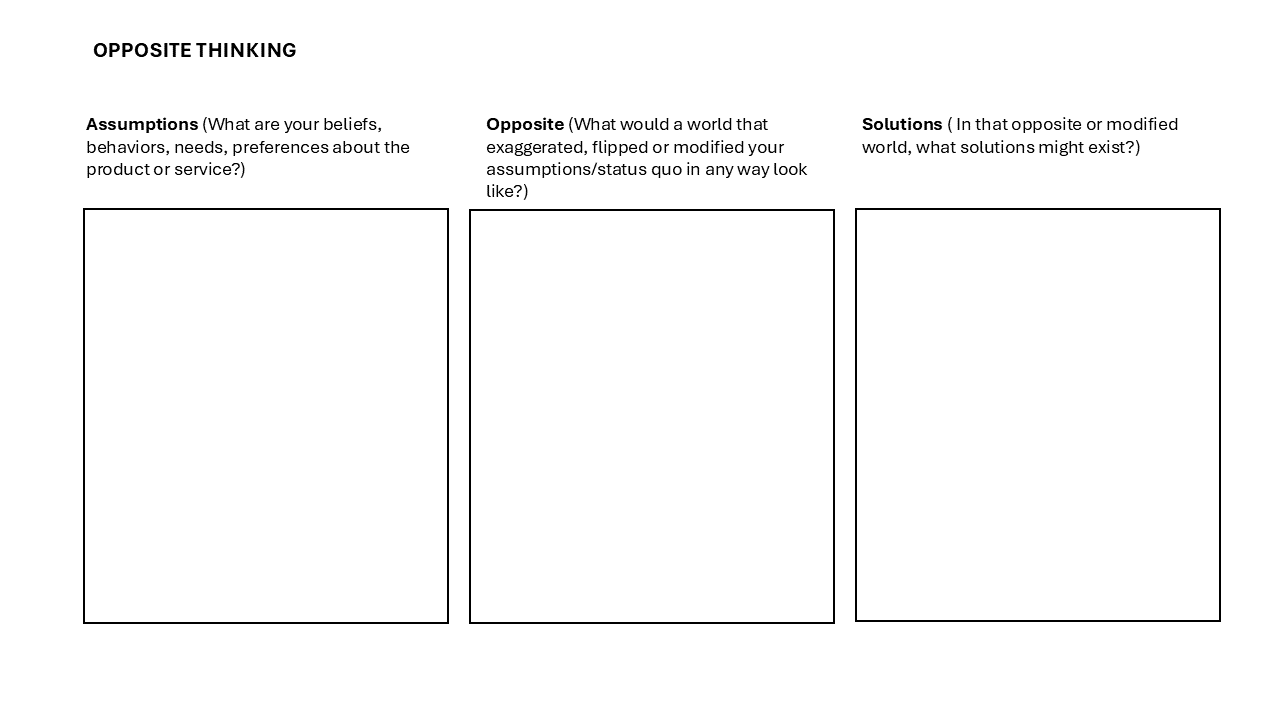
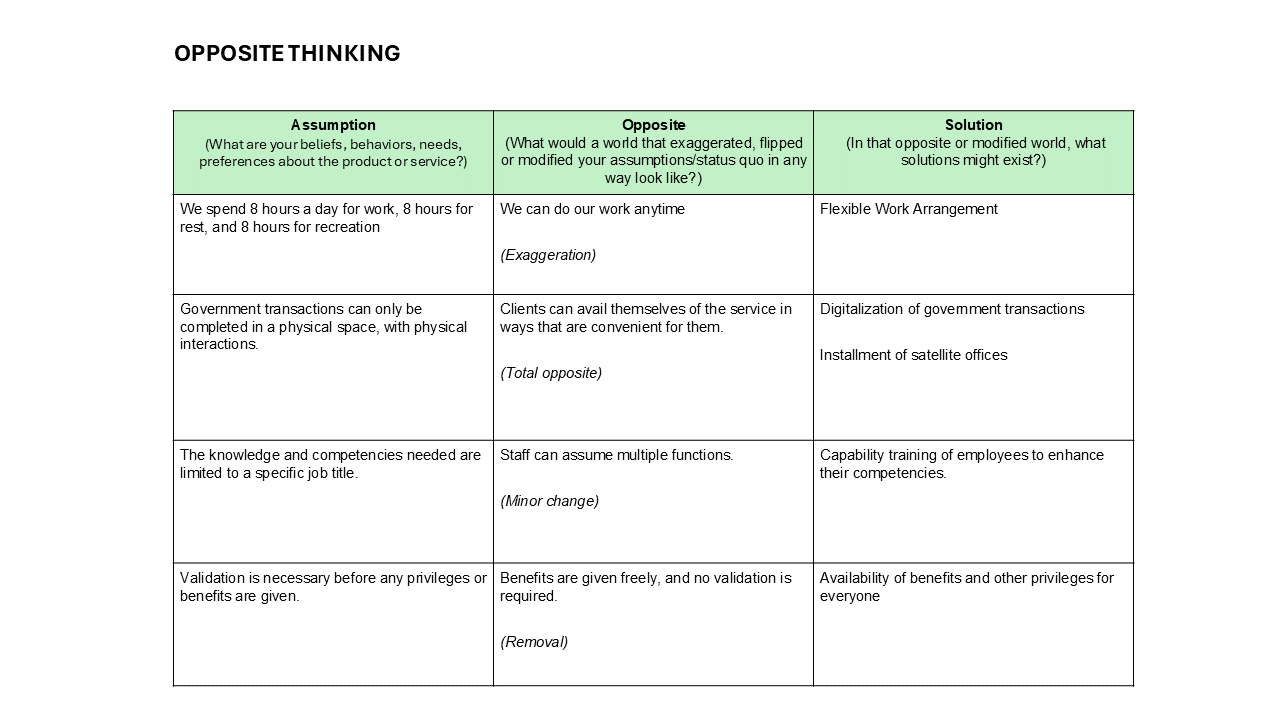
Sample Opposite Thinking
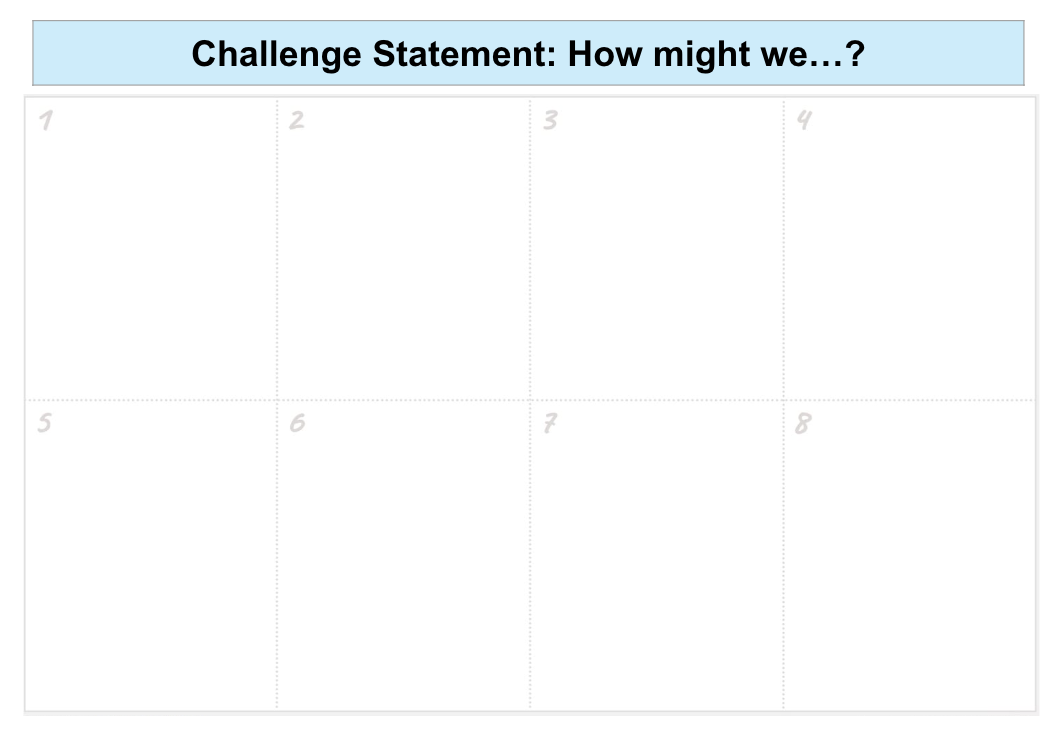
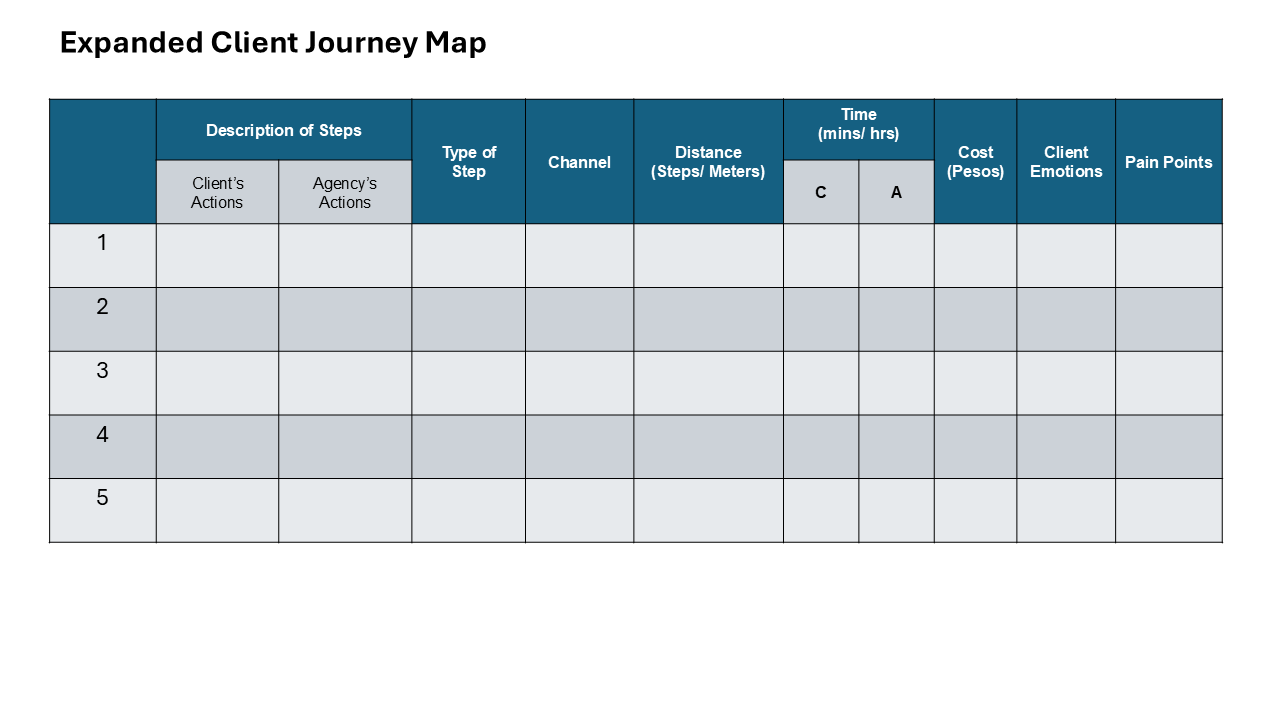
A. Sample Template
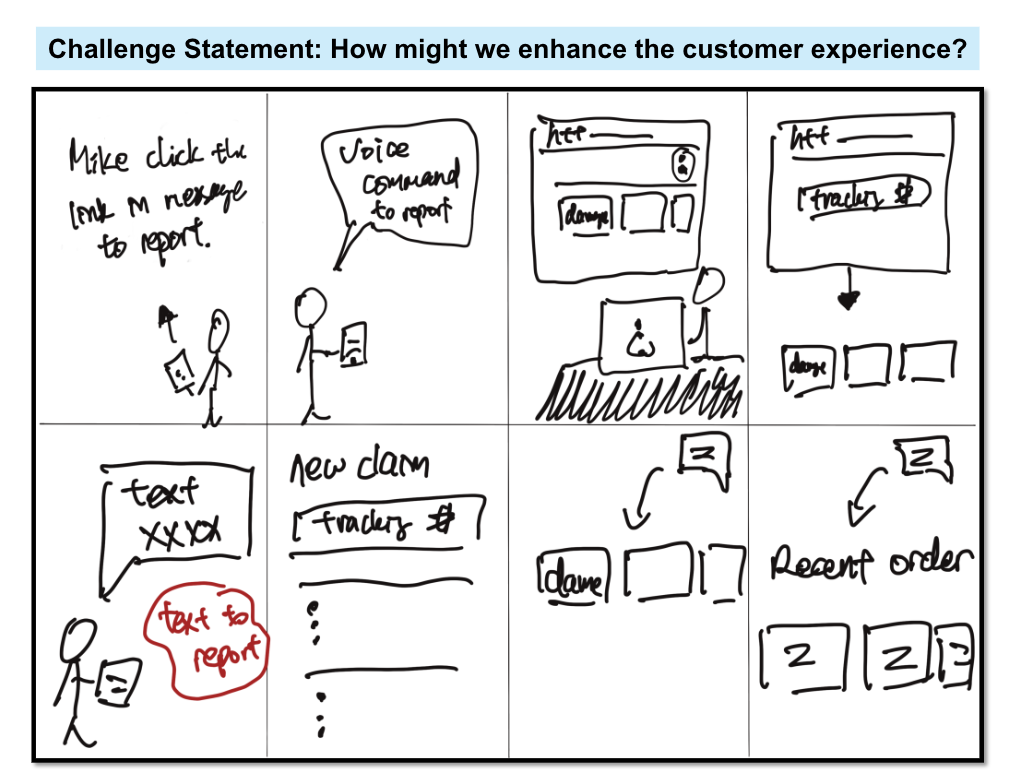
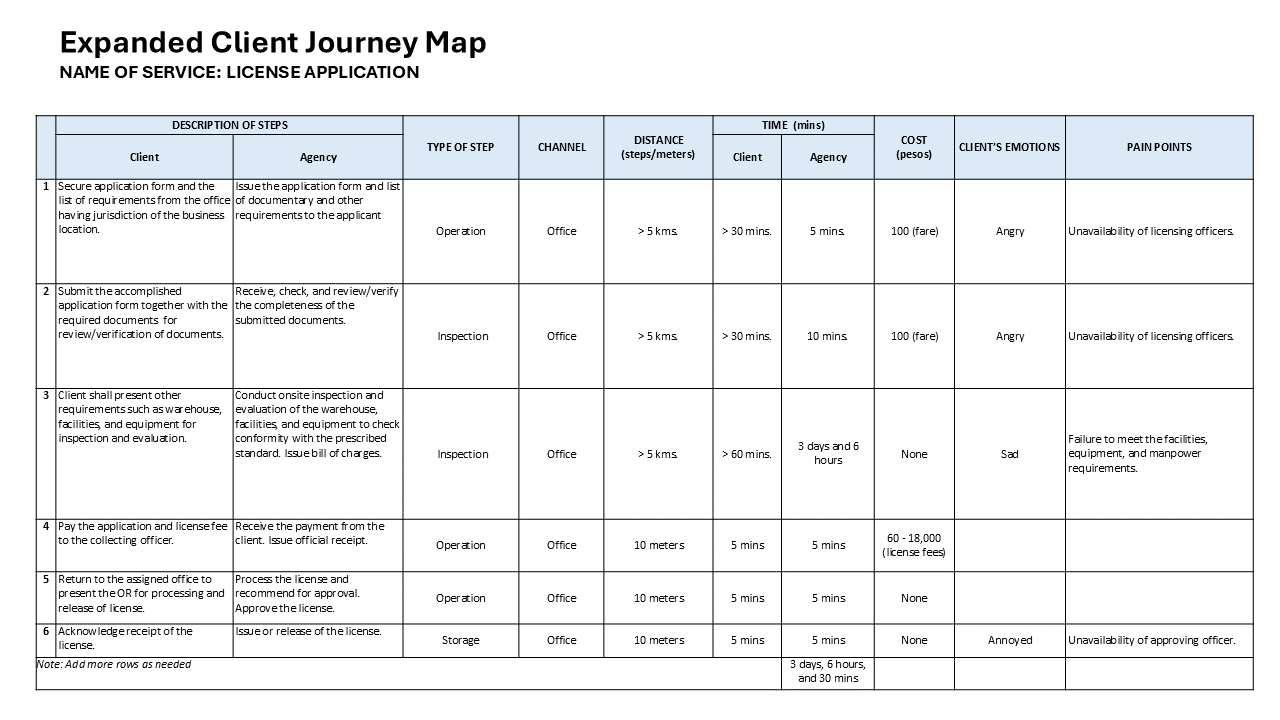
B. Sample Opposite Thinking Output
References:
- Board of Innovation (2024). Opposite Thinking. https://www.boardofinnovation.com/tools/opposite-thinking/
- Interaction Design Foundation. Assumptions in UX/UI Design. https://www.interaction-design.org/literature/topics/assumptions