About the Tool
Purpose: Productivity Measurement
A control chart, or the Shewhart chart, can be used to understand and manage process changes. It uses line graphs to plot sample data at certain time intervals. A center line represents the average of the data points, including lower and upper limit lines, to show if there are significant changes. These changes or variations can be of common cause or special cause. Common cause variations are predictable and cause no process change, while special cause variations require understanding and prevention to prevent future disruptions.
Control charts are essential tools for monitoring and learning about processes. They help identify natural changes, potential issues, and patterns, predict future functionality, and analyze information for improvement. Despite limited use in the public sector, control charts are widely used in organizations.
How to Use the Tool
Estimated Time Needed: 1 hr
Target Participants or Users: Process Owners, Planning Officers, Quality Control Inspectors, Project Managers
Steps
- Organize the data
- Label the columns and input data accordingly.
- Draw the horizontal (x) and vertical (y) axes.
- Label the axes.
- Plot the data on the chart.
- Compute the mean or average. This will be the control line.
Average = n1+n2+n3+n4…/ Number of data - Compute the standard deviation of the dataset. This is used to compute the upper and lower control limits.
Standard deviation = √[ Σ (Individual value – Average)² / Total no. of data points ] - Compute the control limits to define the boundaries of the dataset.
Upper Control Limit = Mean + (3 X Standard Deviation)
Lower Control Limit = Mean – (3 X Standard Deviation) - Draw the upper and lower control limits.
- Write the title of the chart.
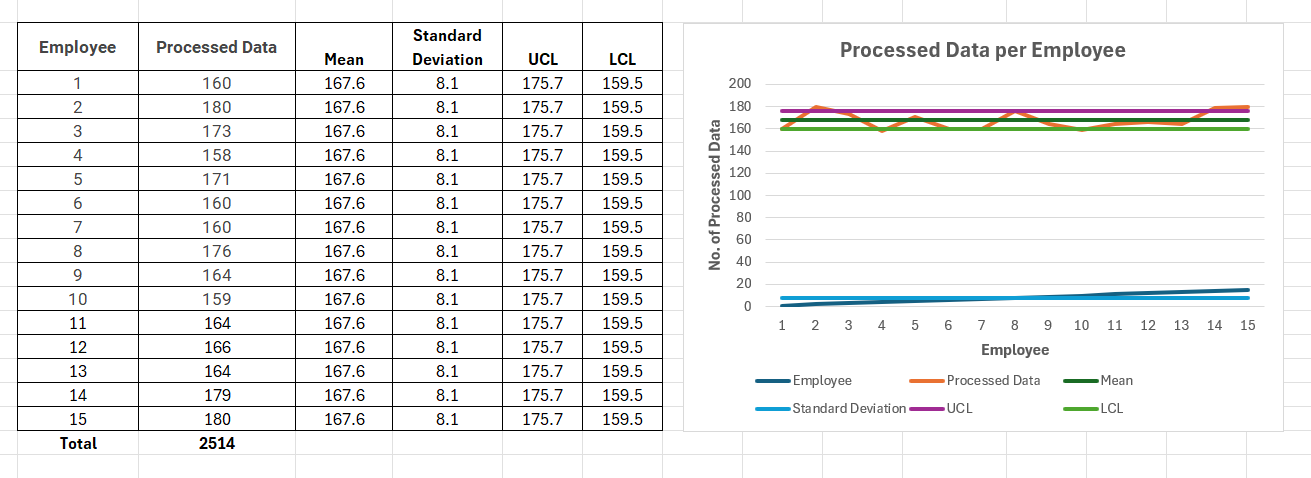
Sample Control Chart