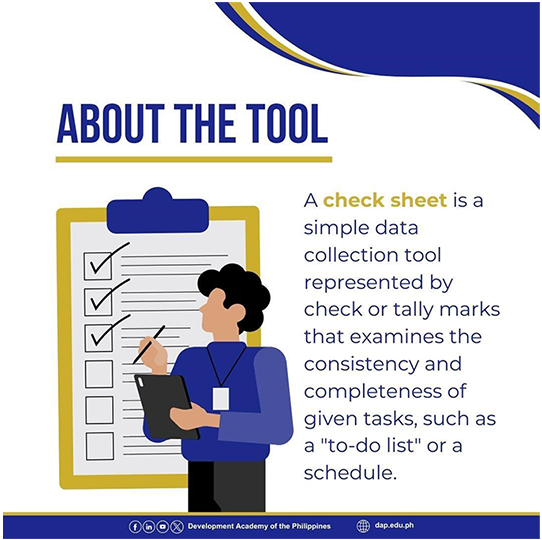
About the Tool
Purpose: Productivity Measurement

It records data in a systematically organized manner by tracking the frequency of specific events, defects, or other information. Check sheets are used to see how a process works and to count mistakes by type, location, and cause.
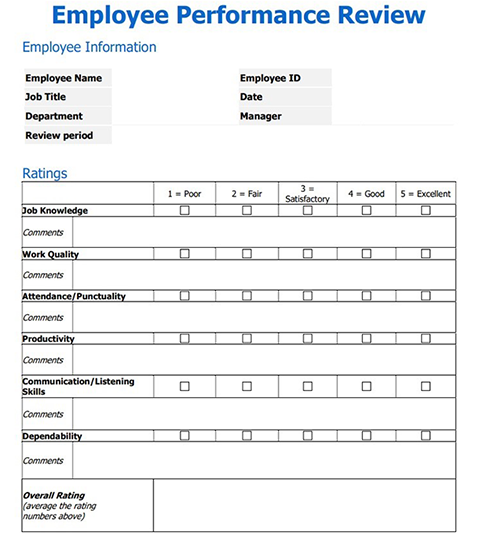
Examples of check sheets:
- A Tally Sheet is frequently used to gather information on quality issues and calculate the frequency of occurrences.
- A Checklist for Process Probability Distribution is used to obtain primary frequency distribution data.
- The Defect Checklist categorizes process flaws based on deformity and frequency of occurrence.
- The Defect Cause Sheet tracks the causes of problems in the process.
- A Location Sheet uses a visual representation of the problems by indicating exactly where the problem is in a certain material.
- Graphical Sheets help people see information and understand how data spreads out.
Using a check sheet in the workplace helps individuals complete their tasks quickly and efficiently.

How to Use the Tool
Estimated Time Needed: 1 hr
Target Participants or Users: Process Owners, Planning Officers, Quality Control Assessors/Evaluators
Steps
- Decide on what data needs to be recorded.
- List the specific information to be monitored and provide a space for comments
- Determine the frequency of data gathering.
- Create the form and label accordingly. Include title, date/time, location, name of the checker/assessor, and categories.
- To verify that all necessary information is provided and that the form is user-friendly, pilot test the checksheet and revise based on the given suggestions.
- Obtain final approval before using the form.
- Educate the users on how to use the form.
References:
Marson, B. (Ed.) (2020). APO Manual: Public-sector Productivity. Asian Productivity Organization https://doi.org/10.61145/LGOT4261
Six Sigma Study Guide https://sixsigmastudyguide.com/check-sheet/
