The APO Center of Excellence on Public Sector Productivity
Philippine Standard Time:
Category: Tertiary education
In 2020, the COE-PSP studied the public sector profiles of various countries in Asia and the Pacific Region. The factsheet below presents selected relevant data and information about public sector productivity and innovation in Japan.
In 2020, the COE-PSP studied the public sector profiles of various countries in Asia and the Pacific Region. The factsheet below presents selected relevant data and information about public sector productivity and innovation in Korea.
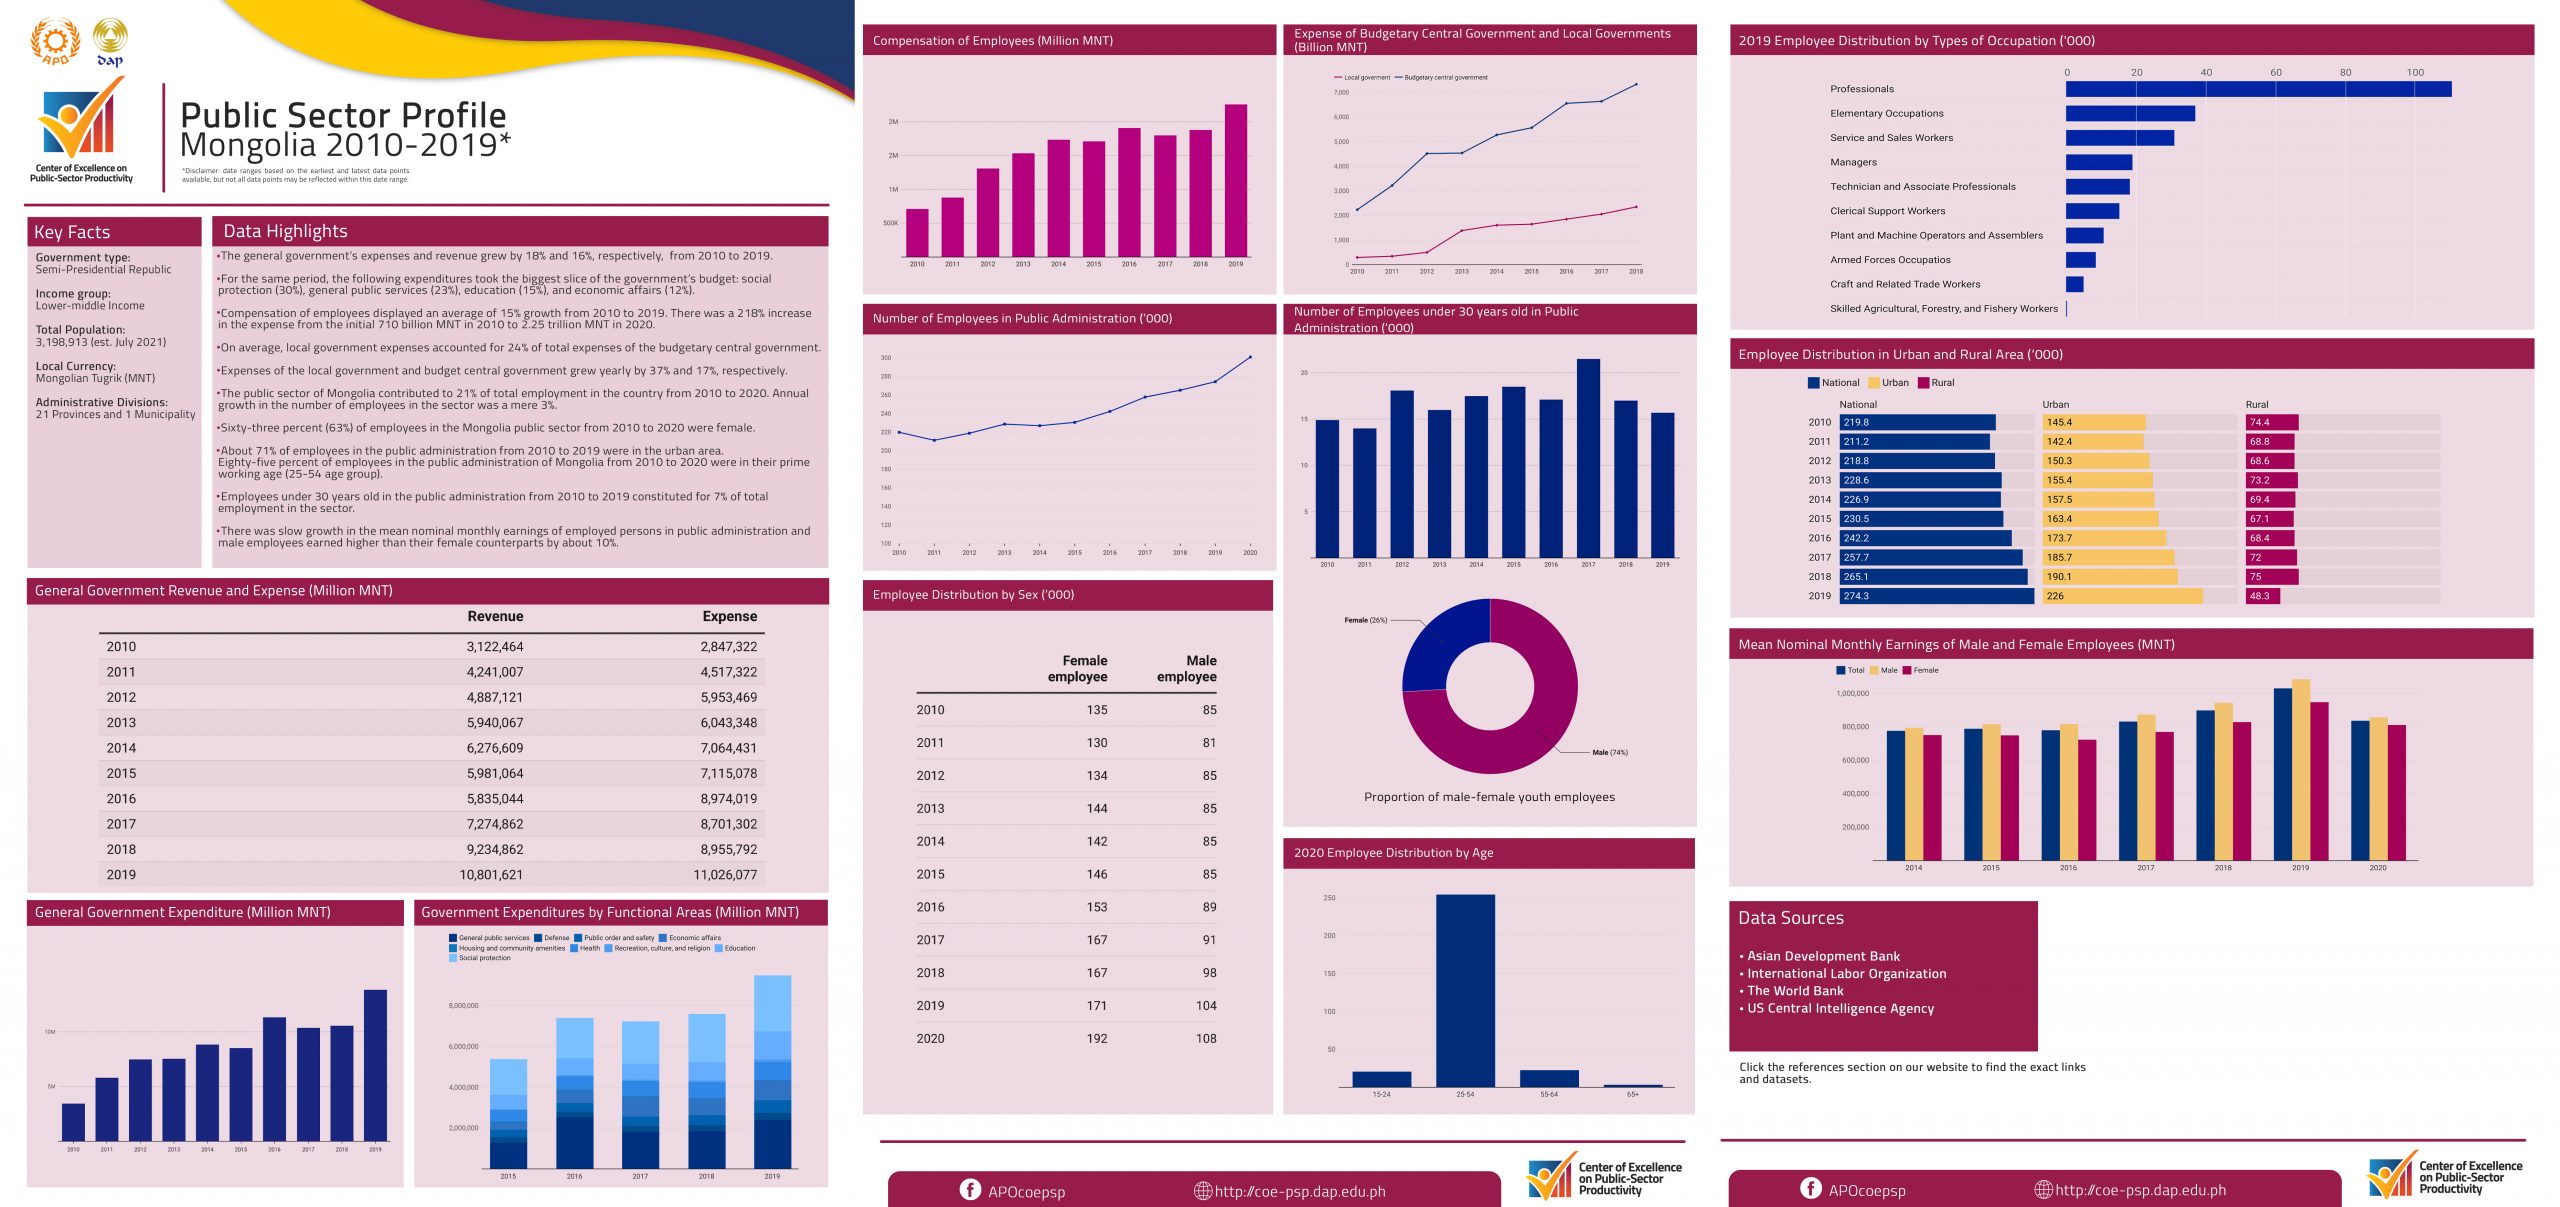
In 2020, the COE-PSP studied the public sector profiles of various countries in Asia and the Pacific Region. The factsheet below presents selected relevant data and information about public sector productivity and innovation in Mongolia.
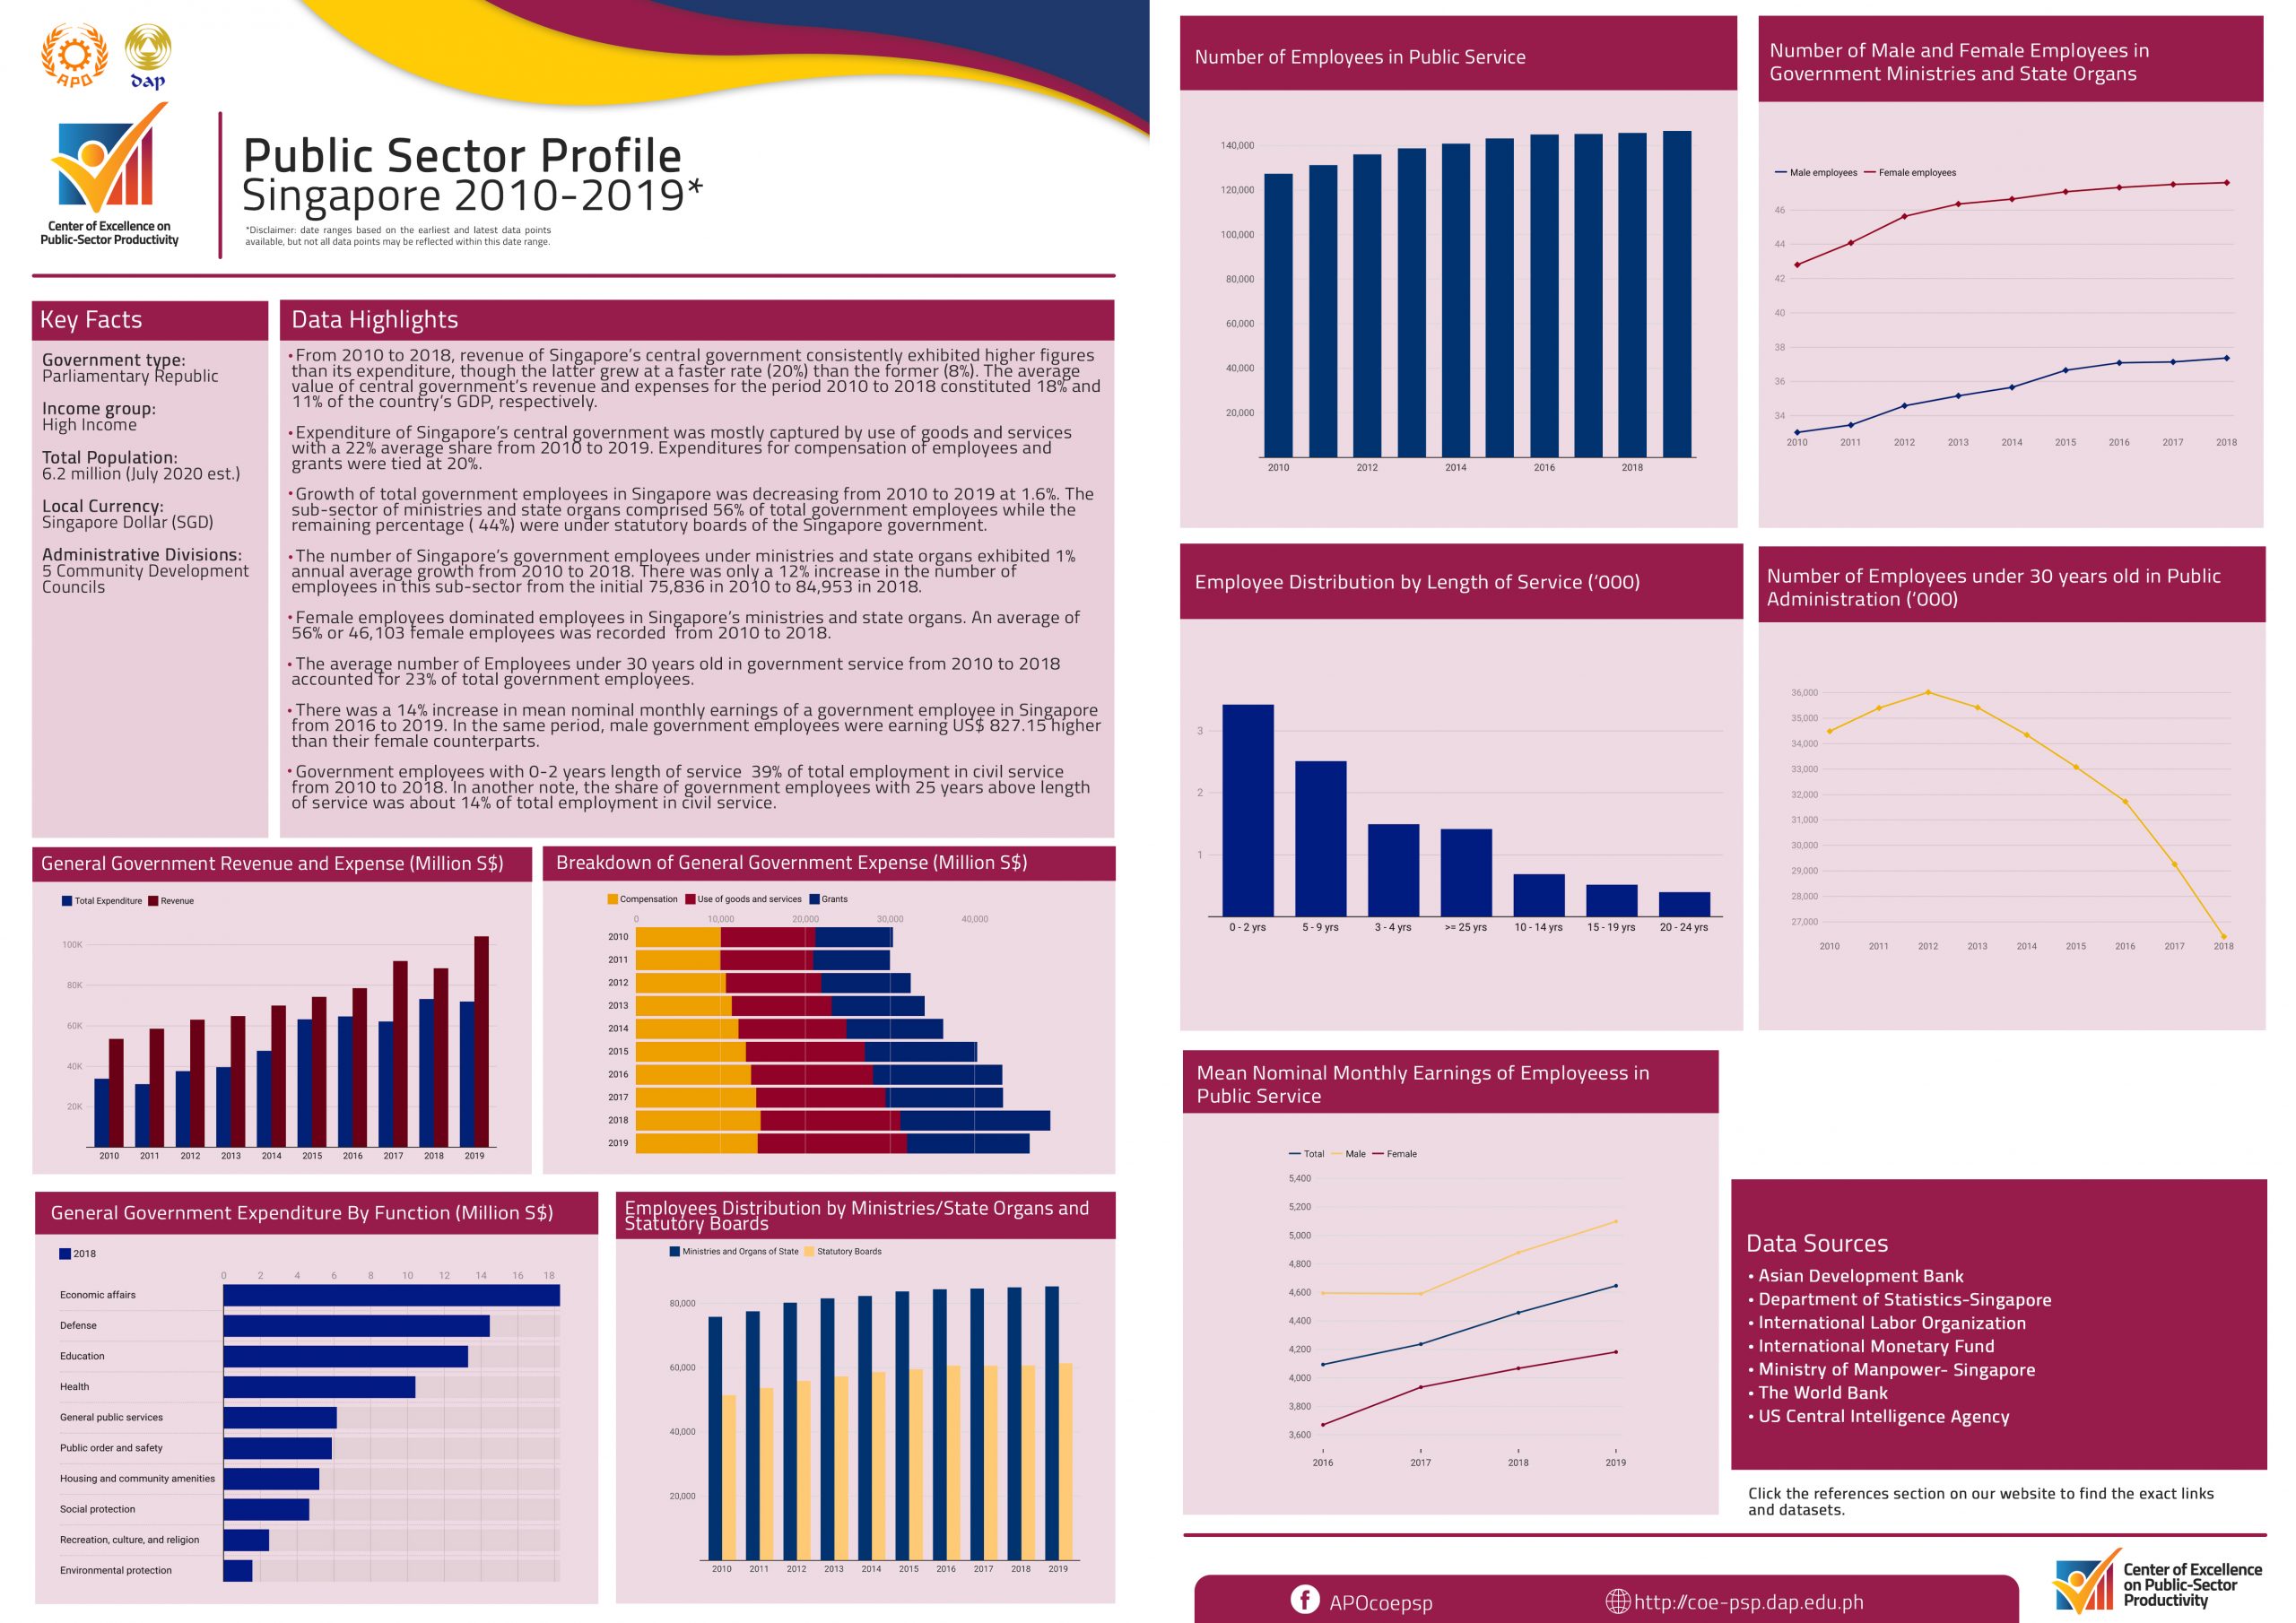
In 2020, the COE-PSP studied the public sector profiles of various countries in Asia and the Pacific Region. The factsheet below presents selected relevant data and information about public sector productivity and innovation in Singapore.
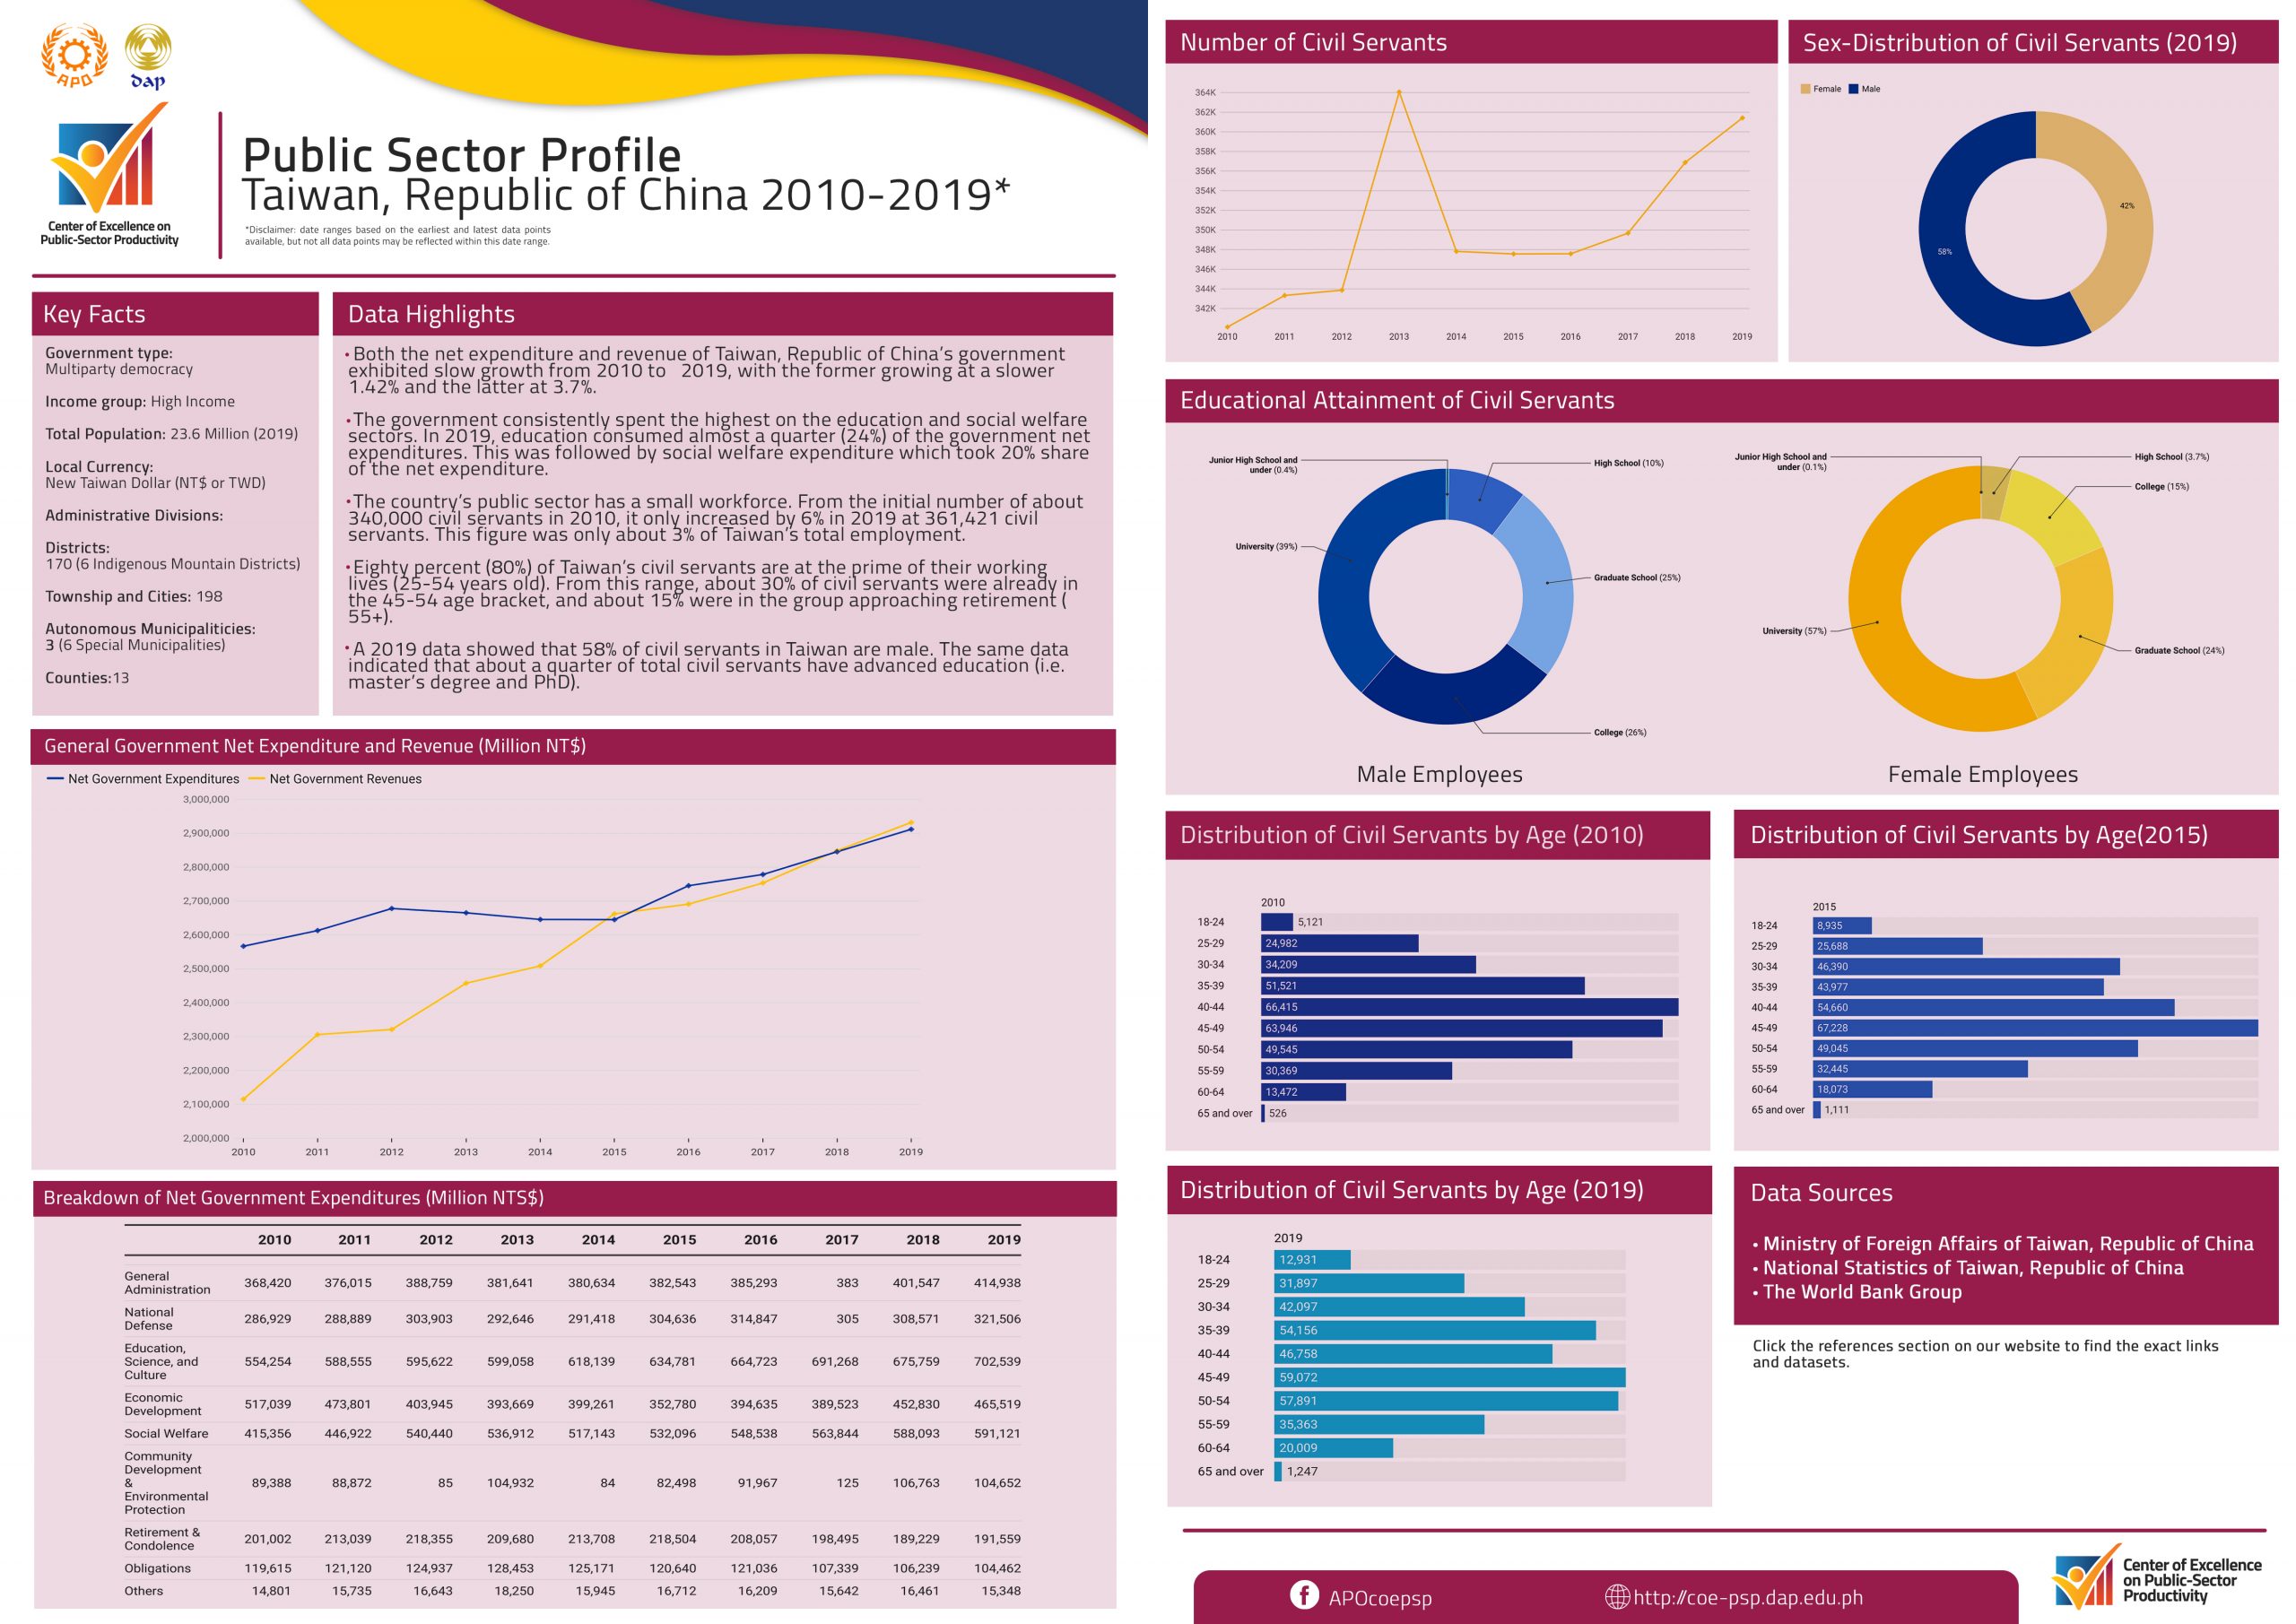
In 2020, the COE-PSP studied the public sector profiles of various countries in Asia and the Pacific Region. The factsheet below presents selected relevant data and information about public sector productivity and innovation in Taiwan.
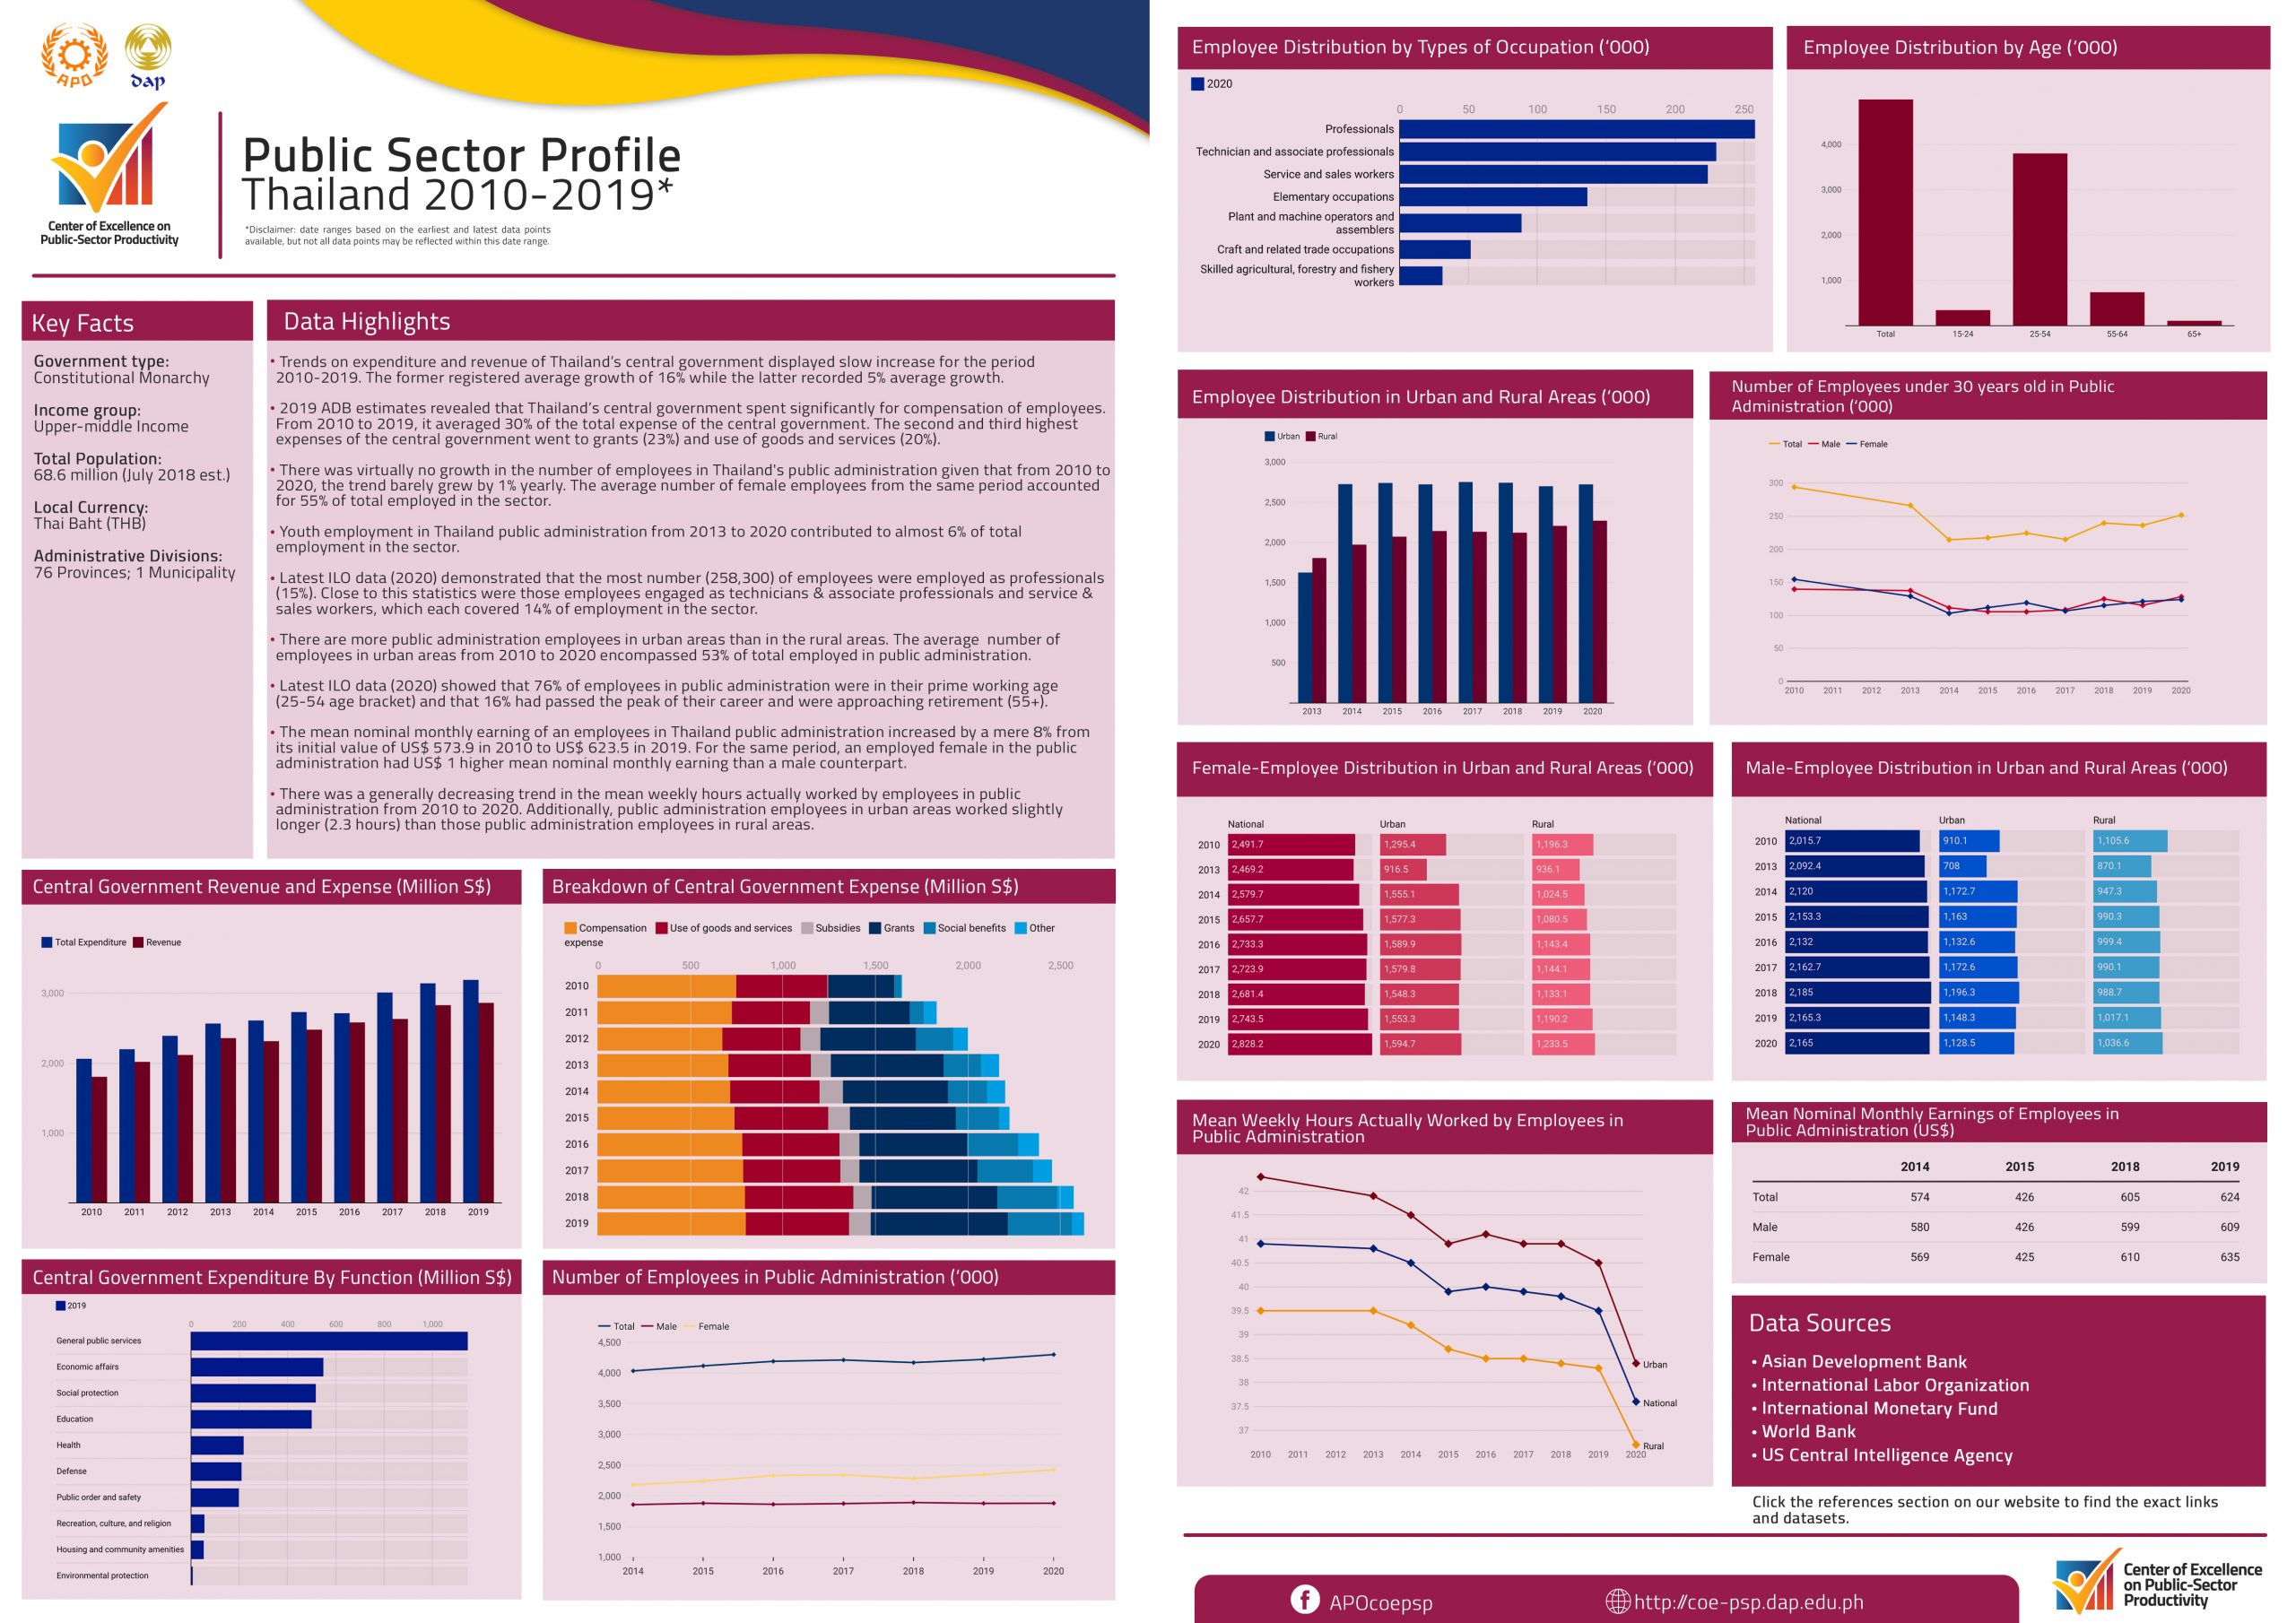
In 2020, the COE-PSP studied the public sector profiles of various countries in Asia and the Pacific Region. The factsheet below presents selected relevant data and information about public sector productivity and innovation in Thailand.
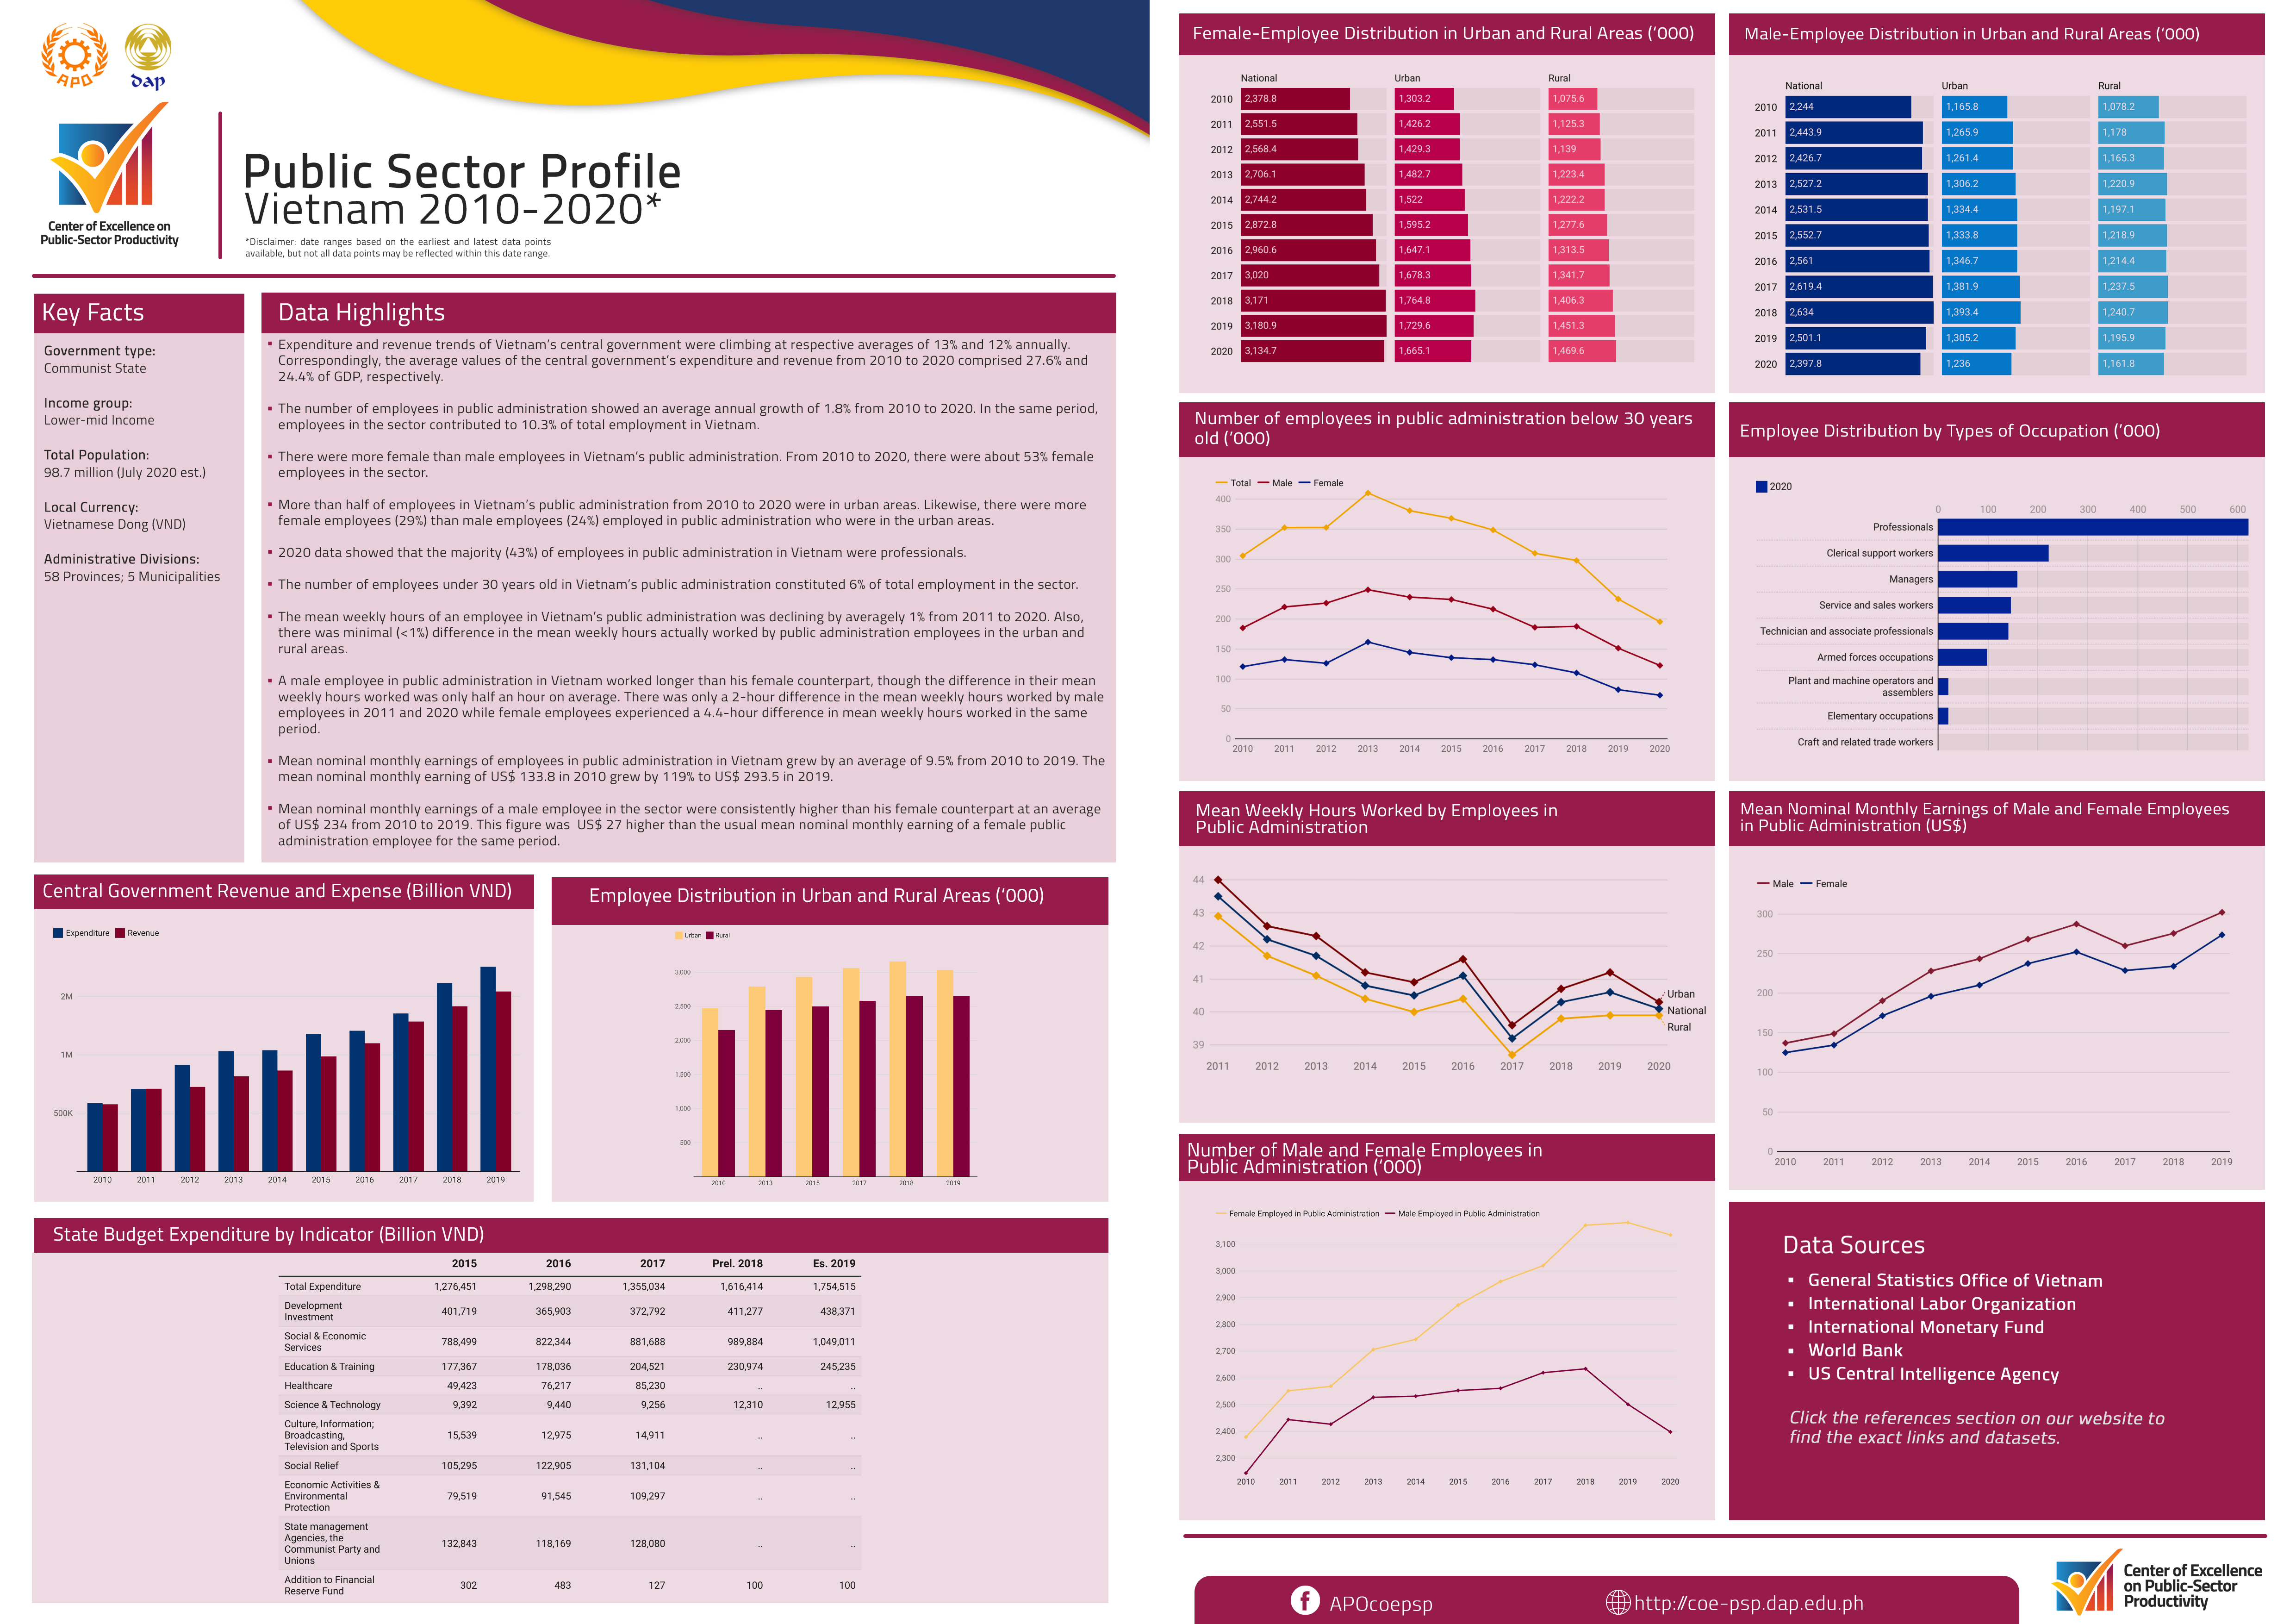
In 2020, the COE-PSP studied the public sector profiles of various countries in Asia and the Pacific Region. The factsheet below presents selected relevant data and information about public sector productivity and innovation in Vietnam.
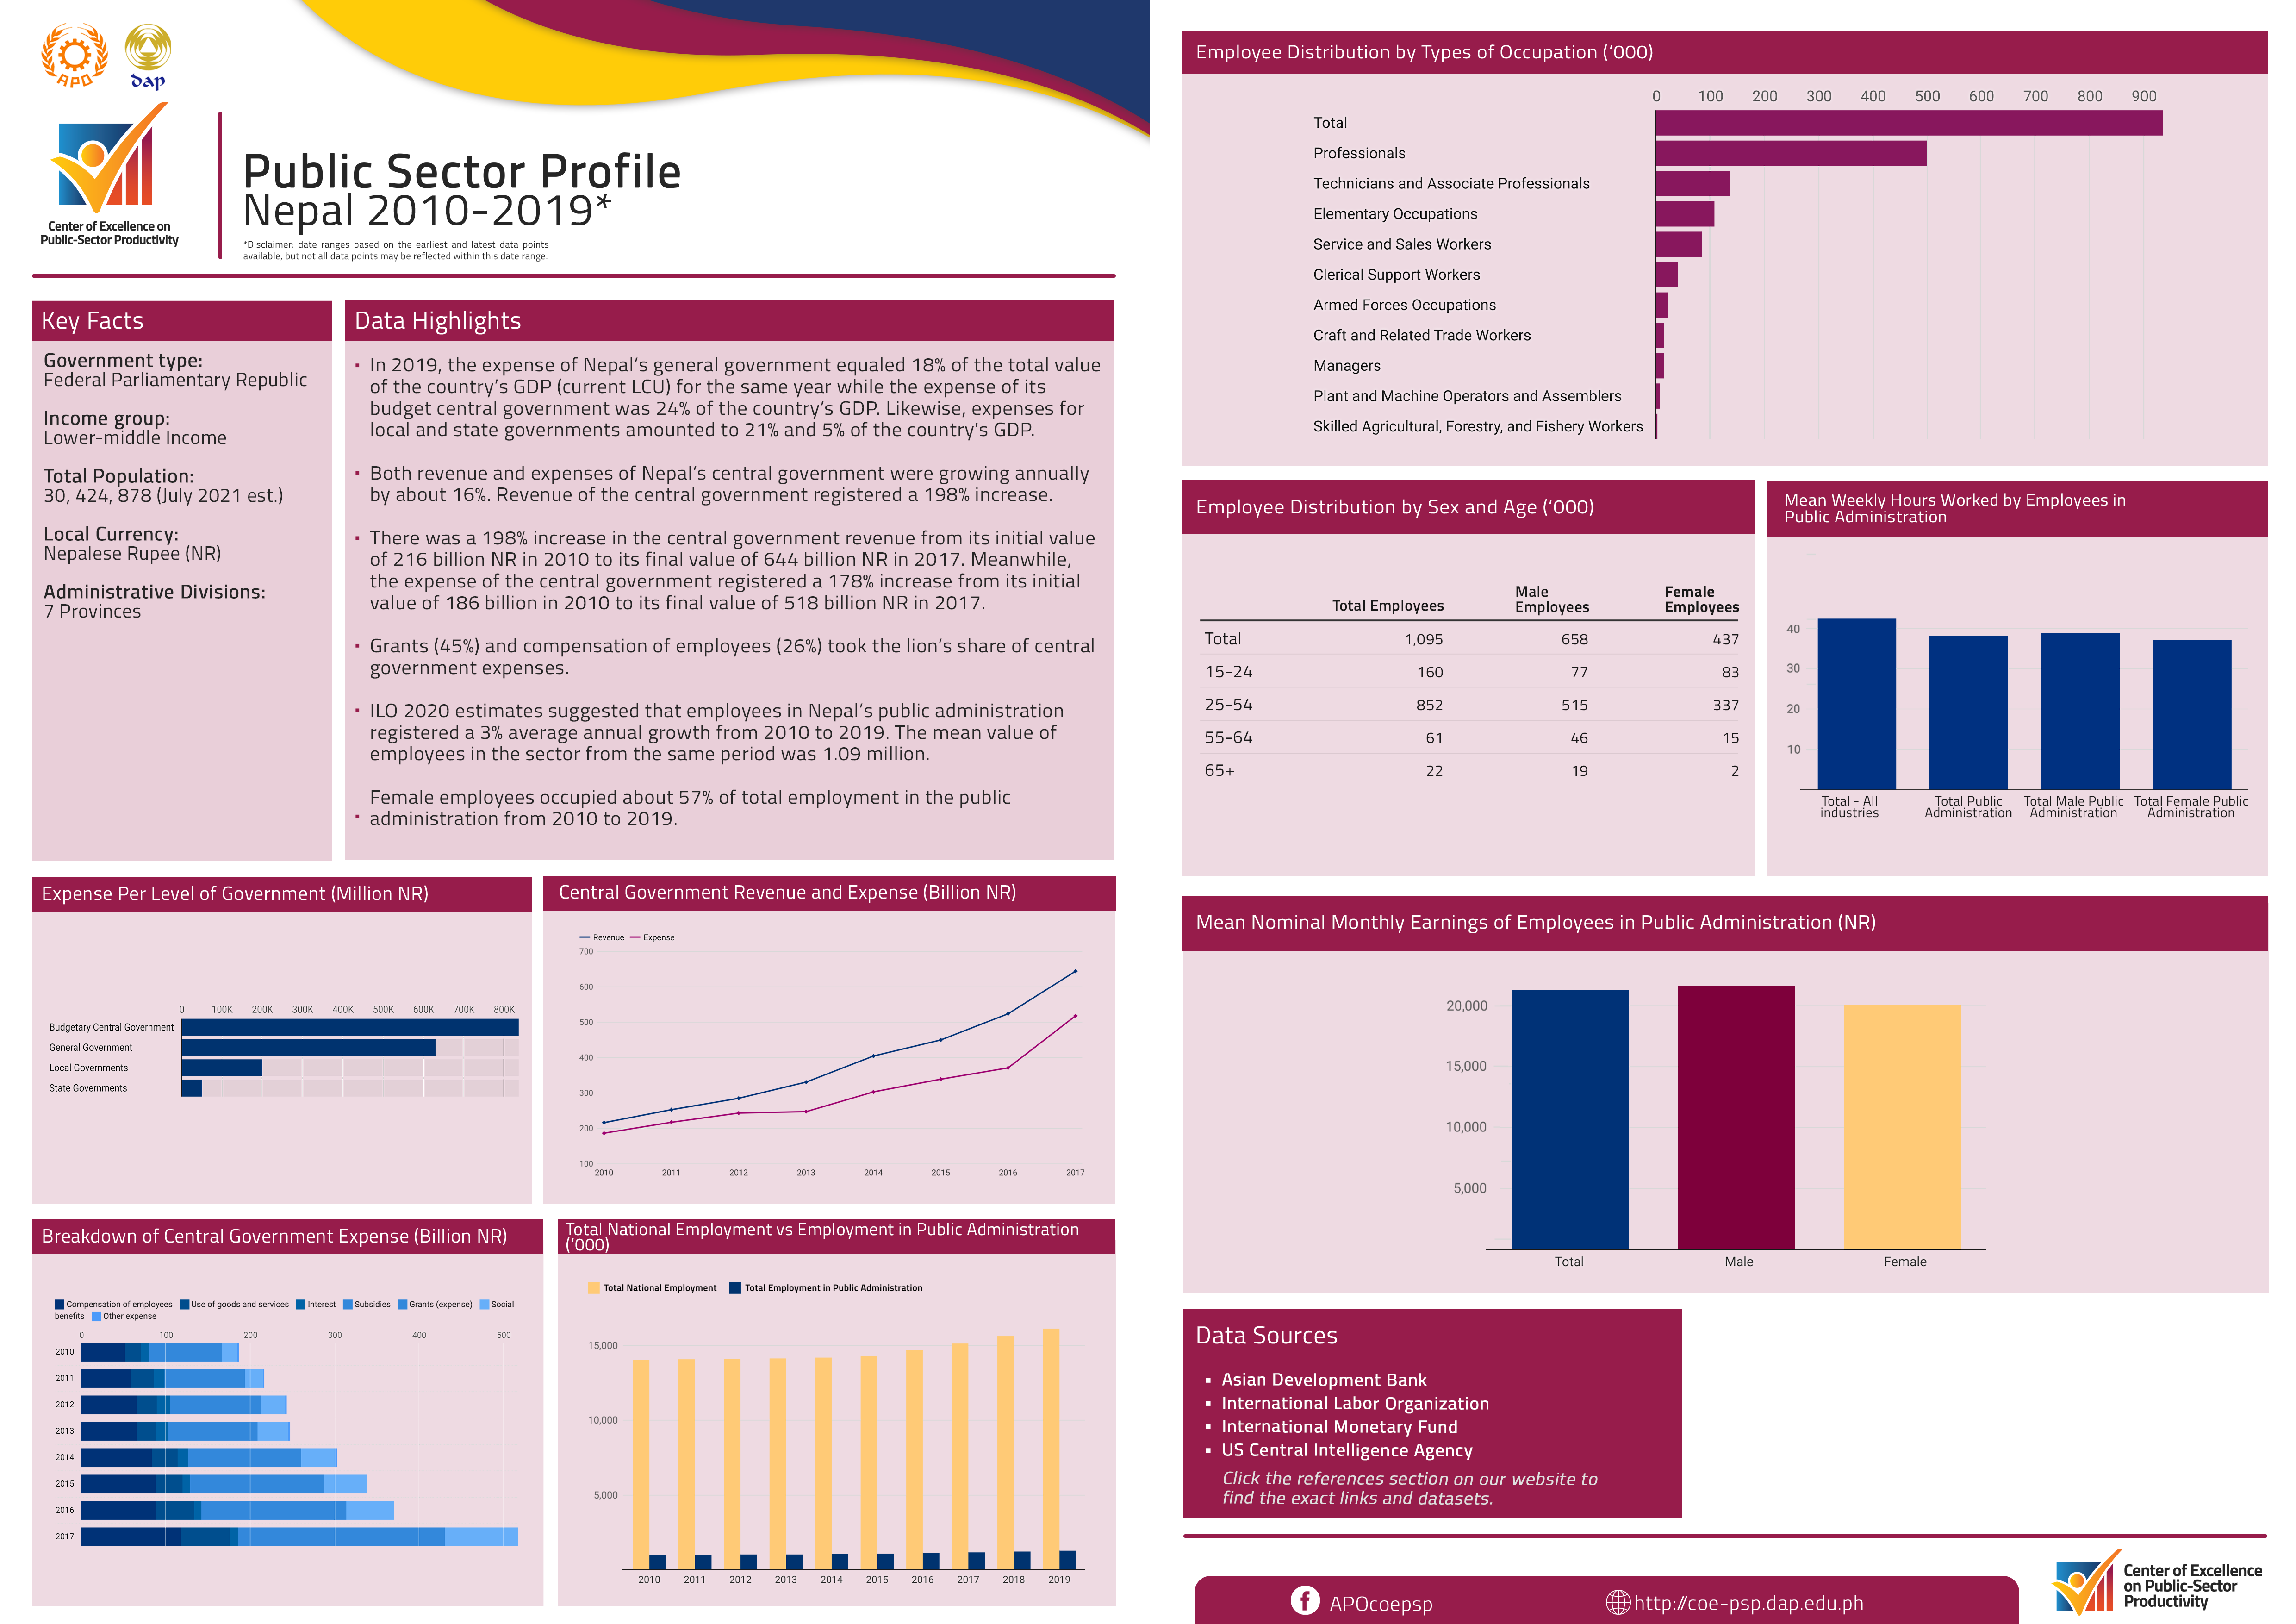
In 2020, the COE-PSP studied the public sector profiles of various countries in Asia and the Pacific Region. The factsheet below presents selected relevant data and information about public sector productivity and innovation in Nepal.
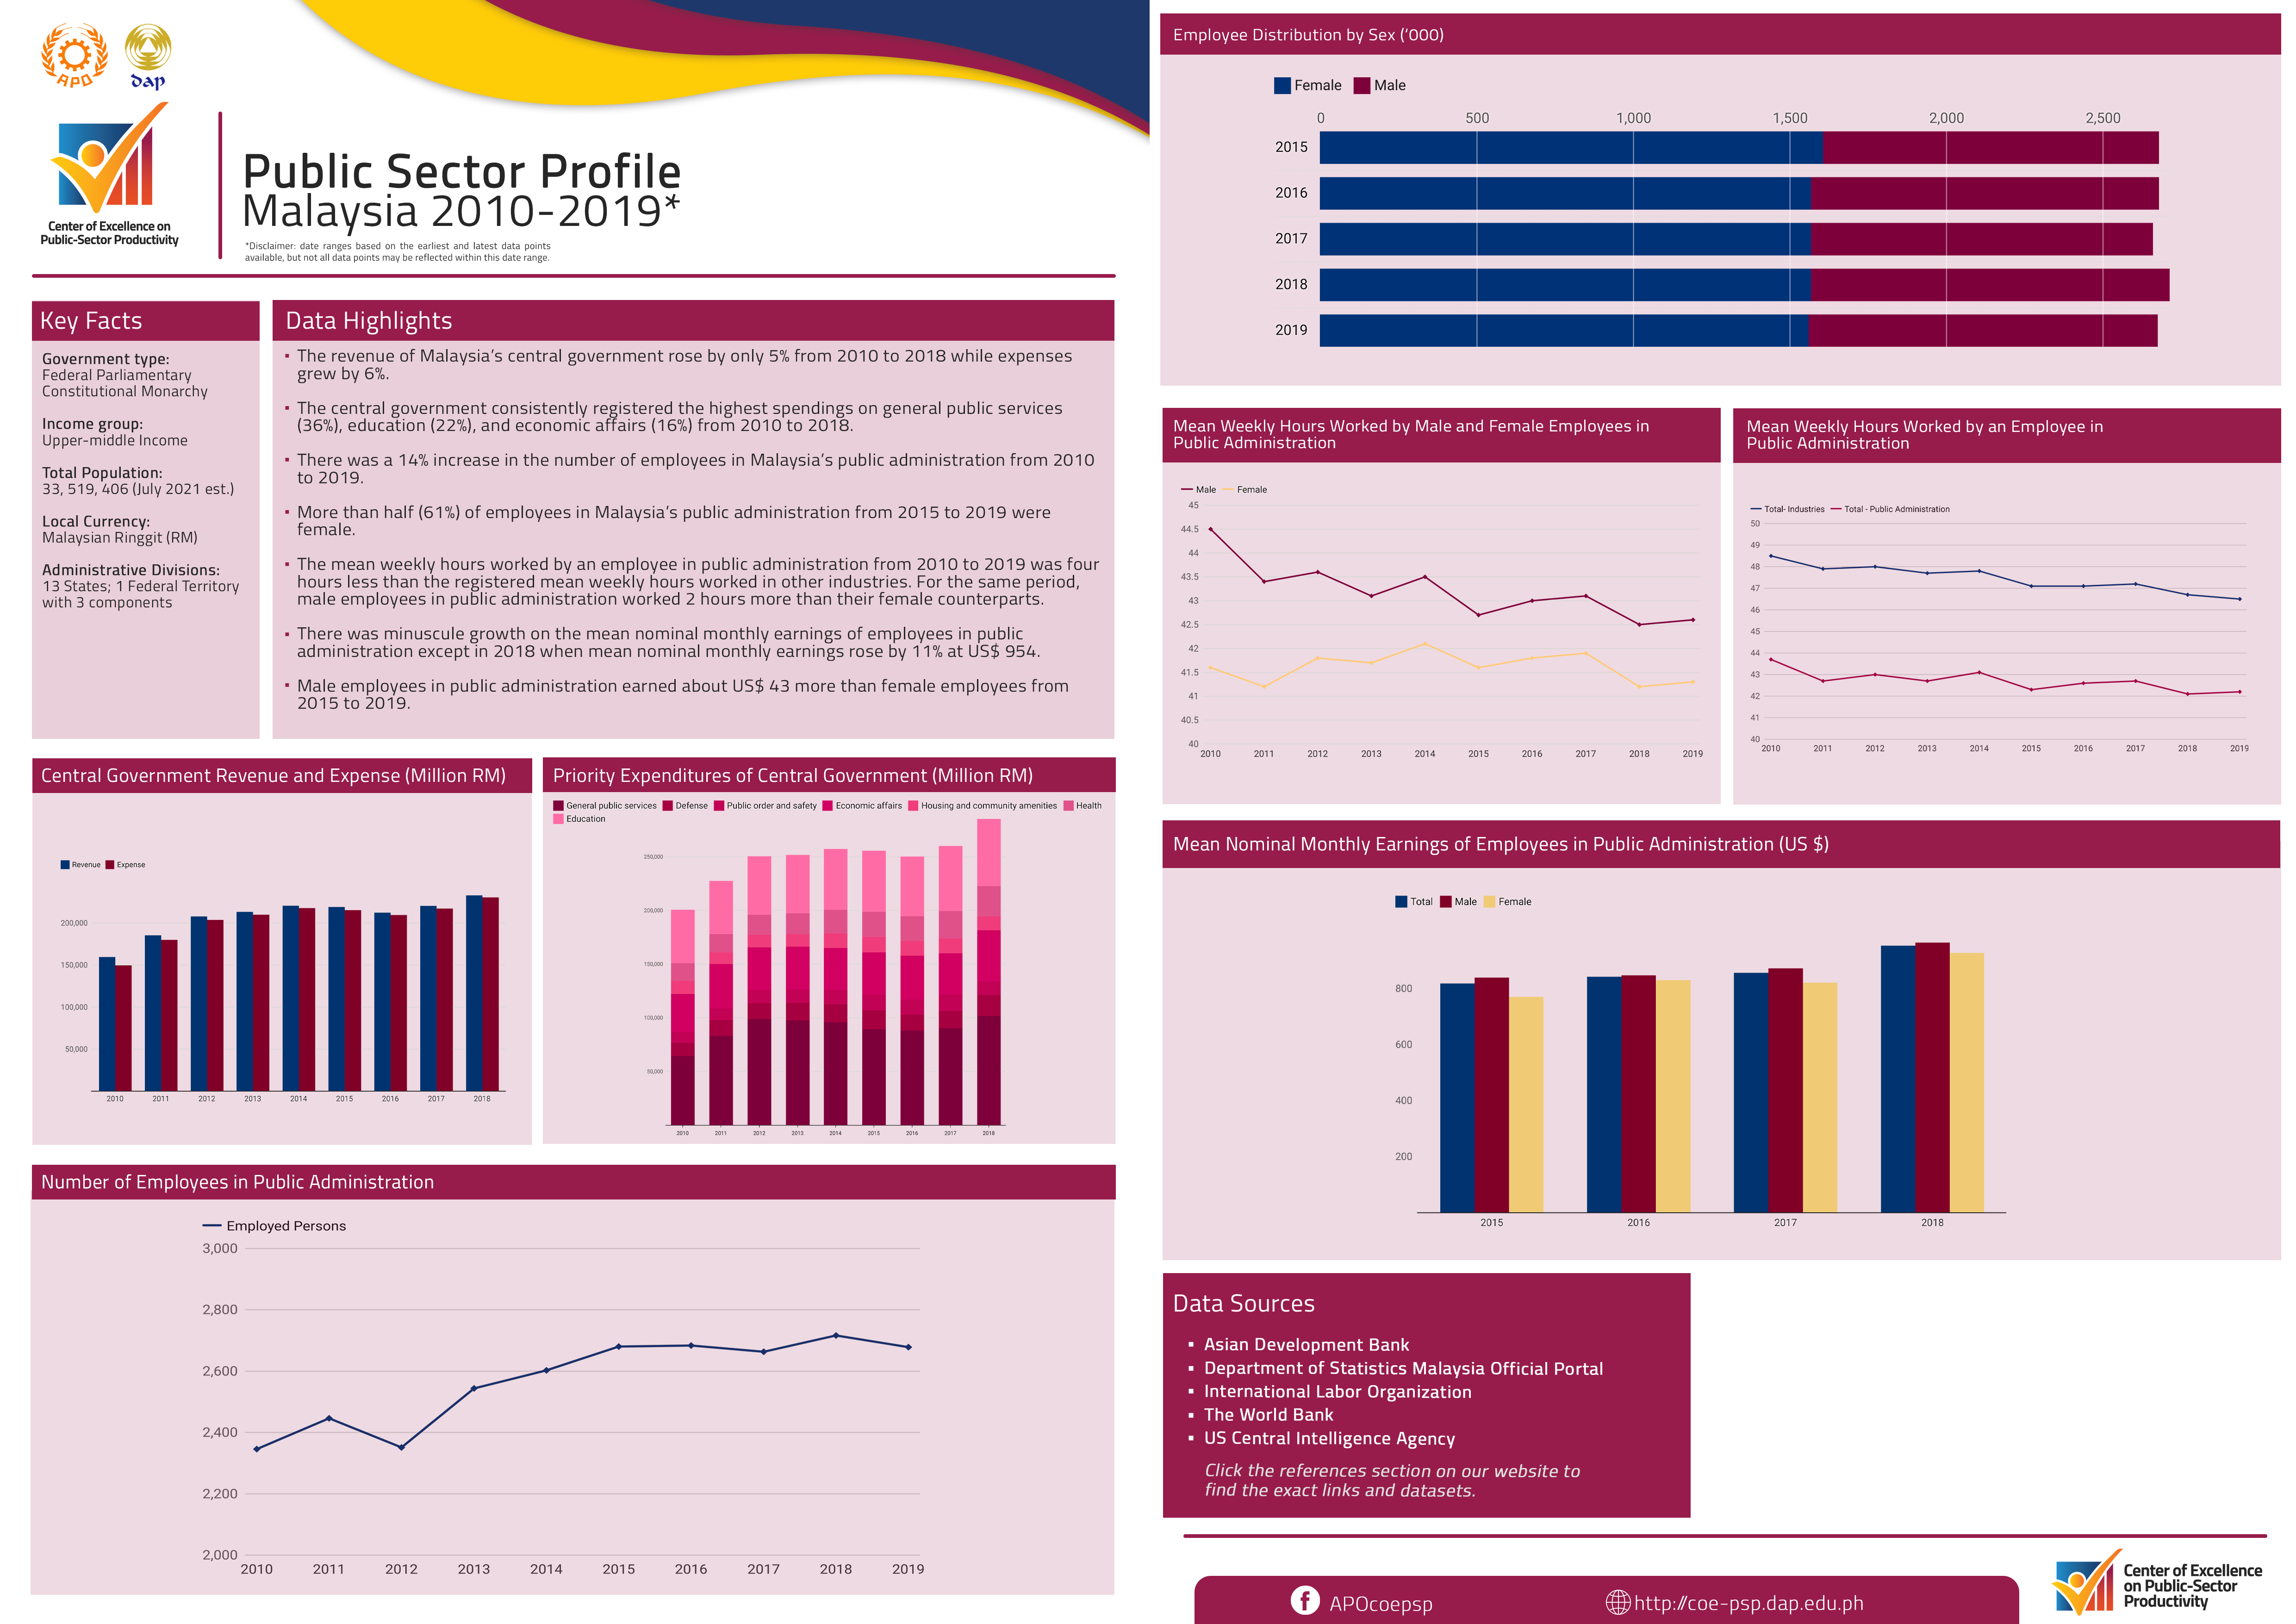
In 2020, the COE-PSP studied the public sector profiles of various countries in Asia and the Pacific Region. The factsheet below presents selected relevant data and information about public sector productivity and innovation in Malaysia.