The APO Center of Excellence on Public Sector Productivity
Philippine Standard Time:
Category: School buildings
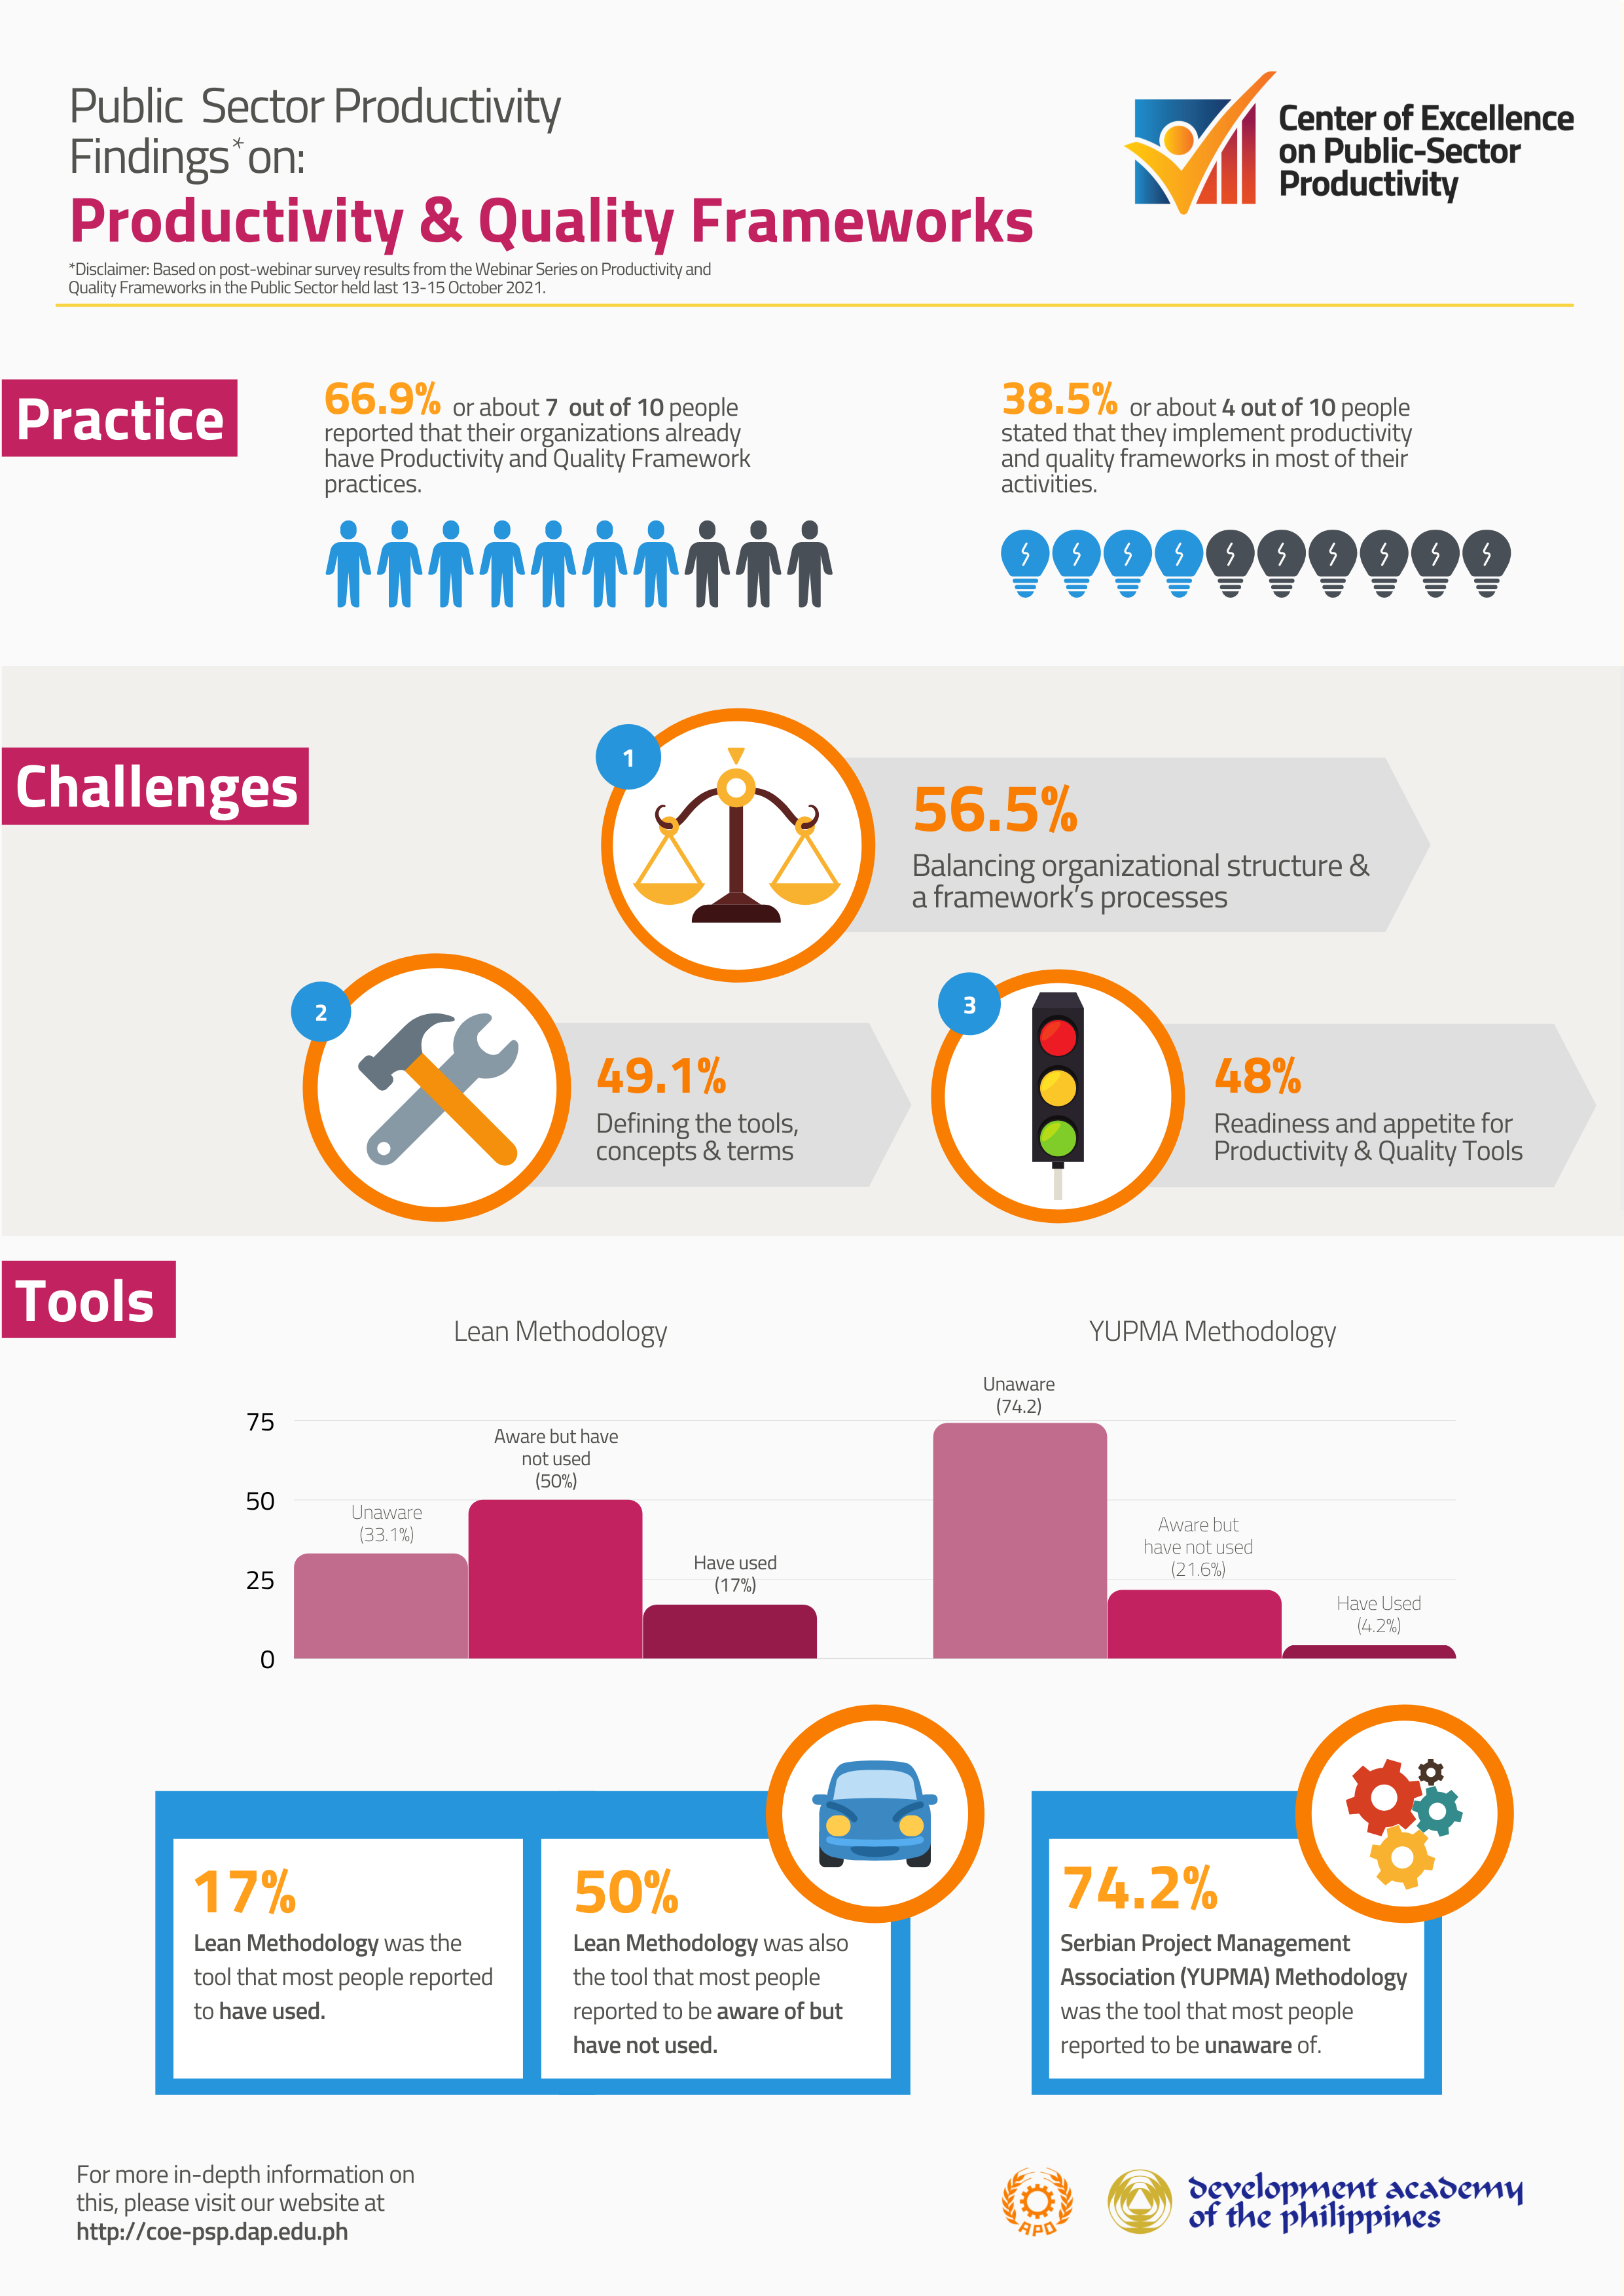
Last 13-15 October 2021, the COE-PSP Knowledge Center ran a webinar on Productivity and Quality Management, featuring Engr. Charlie A. Marquez, DAP resource speaker; Dr. Ralph Sherwin A. Corpuz, director of Quality Assurance at the Technological University of the Philippines; and Dr. Juliet J. Balderas, head of Management Services Department at the Philippine Heart Center (PHC).
Below is a summary and analysis of the responses gathered from the post-webinar survey, highlighting the discussion on the participant’s demographic profile and the results of the assessment.
Last 13 August 2021, the COE-PSP Knowledge Center ran a webinar on Knowledge Management in the new normal context, featuring Jon Del Rosario, supervising fellow and professor of Knowledge Management and Quality Management of DAP Graduate School of Public and Development Management, and Dr. Enrique Tayag, director of the Department of Health’s Knowledge Management and Information Technology Service.
Below is a summary and analysis of the responses gathered from the post-webinar survey, highlighting the discussion on the participant’s demographic profile and the results of the knowledge management assessment.
Last 15-17 September 2021, the COE-PSP Knowledge Center ran a webinar on Innovative Thinking for Enhancing Public Sector Productivity, featuring innovation champions, Adrian Ramirez, Leanne Lozanes, Anita S. Gubalane, and Paul Vincent Avecilla.
Below is a summary and analysis of the responses gathered from the post-webinar survey, highlighting the discussion on the participant’s demographic profile and results of the assessment.
Abstract:
The productivity figures presented in Public Service Output, Inputs and Productivity: Education (ONS 2009) are best estimates using the most recently available data. This supporting article presents further detail on the components of output:
Section 2 reports demographic patterns over recent history
Section 3 provides extended analyses of quantity by country
Section 4 provides extended analyses of quality by country
Section 5 provides extended analyses of output by country
“The productivity figures presented in Public Service Output, Inputs and Productivity: Education (ONS 2009) are best estimates using the most recently available data. Estimates of productivity change need to be interpreted alongside other indicators of inputs, outputs and outcomes. It is unlikely that a single measure of productivity change will ever capture all the costs and benefits of education. The aim of triangulation is to help users understand the productivity estimates by providing additional contextual information, giving a wider picture that has not been shown in the compilation of the education productivity estimates themselves. The Atkinson Review: Final Report – Measurement of Government Output and Productivity for the National Accounts (Atkinson 2005) suggests information on quality of teaching and class size would be useful for helping this process of triangulation, although data may not be suitable for direct inclusion in the National Accounts measure. This evidence is not necessarily expected to corroborate estimates of productivity change, as sources vary in their scale and scope and therefore rarely cover exactly the same thing. For each evidential measure, an indication is given of:
the likely degree of influence schools have on each triangulation measure, which is currently not quantified
the coherence of changes in each triangulation measure with changes in input, quantity or quality
In the remainder of this article:
section 2 presents a table summarising the triangulation evidence section 3 looks at the quantification of factors affecting children and young people’s outcomes section 4 discusses the scope of wider outcomes for children and young people section 5 presents evidence on the quality of education section 6 highlights evidence on children and young people’s physical, mental and sexual health section 7 looks at evidence on children and young people’s safety section 8 looks at evidence on economic outcomes for children and young people section 9 gives references”