The Development Academy of the Philippines (DAP), through its Center of Excellence on Public Sector Productivity (COE-PSP), hosted the fifth and final episode of the Productivity Insights series on July 18, 2024. Sarah Afiqah Binti Kamaruzaman, assistant manager of the Malaysia Productivity Corporation (MPC), presented on “Productivity in Action by Implementing Good Regulatory Practice in Malaysia,” highlighting the vital role of Good Regulatory Practice (GRP) in enhancing Malaysia’s productivity. The virtual event attracted 350 participants from various government offices.
Good Regulatory Practices are designed to protect the public interest and foster a competitive business environment for Malaysian enterprises through effective, transparent, and business-friendly regulations. Afiqah illustrated GRP’s positive impacts with practical examples, including a notable case study on private hospital construction regulations. Initially limited by security concerns, MPC’s review process, involving consultations and benchmarking, led to regulatory changes that increased health infrastructure investment and addressed urban development challenges.
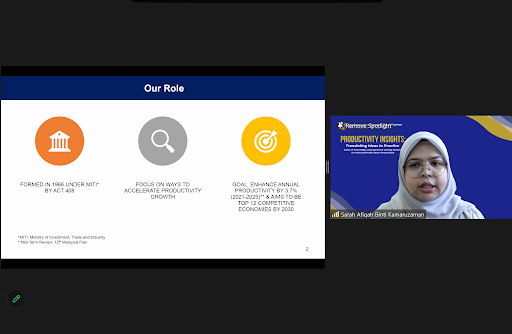
MPC aims for a 3.7 percent annual productivity growth by 2025, aspiring to position Malaysia among the top 12 competitive economies globally by 2030. This vision is driven by the Malaysia Productivity Blueprint, focusing on workforce improvement, digitalization, and innovation ecosystems. Afiqah emphasized that these initiatives equip Malaysia to thrive in an evolving global economy.
Collaborations with global organizations like the World Bank and World Economic Forum have been crucial to MPC’s success. These collaborations allow MPC to benchmark Malaysia’s regulatory standards globally, adopting best practices to enhance regulation quality and effectiveness. Aligning local regulations with international standards ensures Malaysia remains attractive for investment and economic growth.
Afiqah affirmed MPC’s commitment to advancing Malaysia’s productivity agenda through innovative strategies and robust regulatory frameworks. By advocating for GRP and fostering public-private partnerships, MPC aims to enhance productivity growth, competitiveness, and citizen prosperity. She concluded by emphasizing Malaysia’s proactive approach to achieving global competitiveness and sustainable economic growth. With MPC’s dedication to excellence and innovation, Malaysia is poised to become a significant economic power in the region and beyond, supported by a robust regulatory framework and clear vision.
Productivity Insights is an initiative of DAP through its COE-PSP. This series of knowledge and experience-sharing sessions showcases best practices from local participants and APO-member economies, aiming to boost innovation and productivity in the public sector.
As the Philippines’ National Productivity Organization and COE-PSP, the DAP is committed to promoting and implementing public sector productivity-related activities across the Asia-Pacific region. The COE-PSP plays a fundamental role in this mission by facilitating the exchange of knowledge on public sector productivity (PSP) best practices among APO-member economies. It conducts relevant PSP and innovation-related research and develops knowledge products, including resources and materials to support member countries’ programs.
Through the COE-PSP, the DAP undertakes projects designed to help APO-member economies develop and strengthen their productivity programs, enhancing efficiency and effectiveness in the public sector. By fostering a culture of innovation and continuous improvement, the DAP strives to elevate public sector productivity, ultimately contributing to the region’s economic growth and competitiveness.
This article is originally posted on: https://dap.edu.ph/dap-hosts-final-episode-of-productivity-insights-series-with-focus-on-malaysias-role-of-good-regulatory-practice/