About the Tool
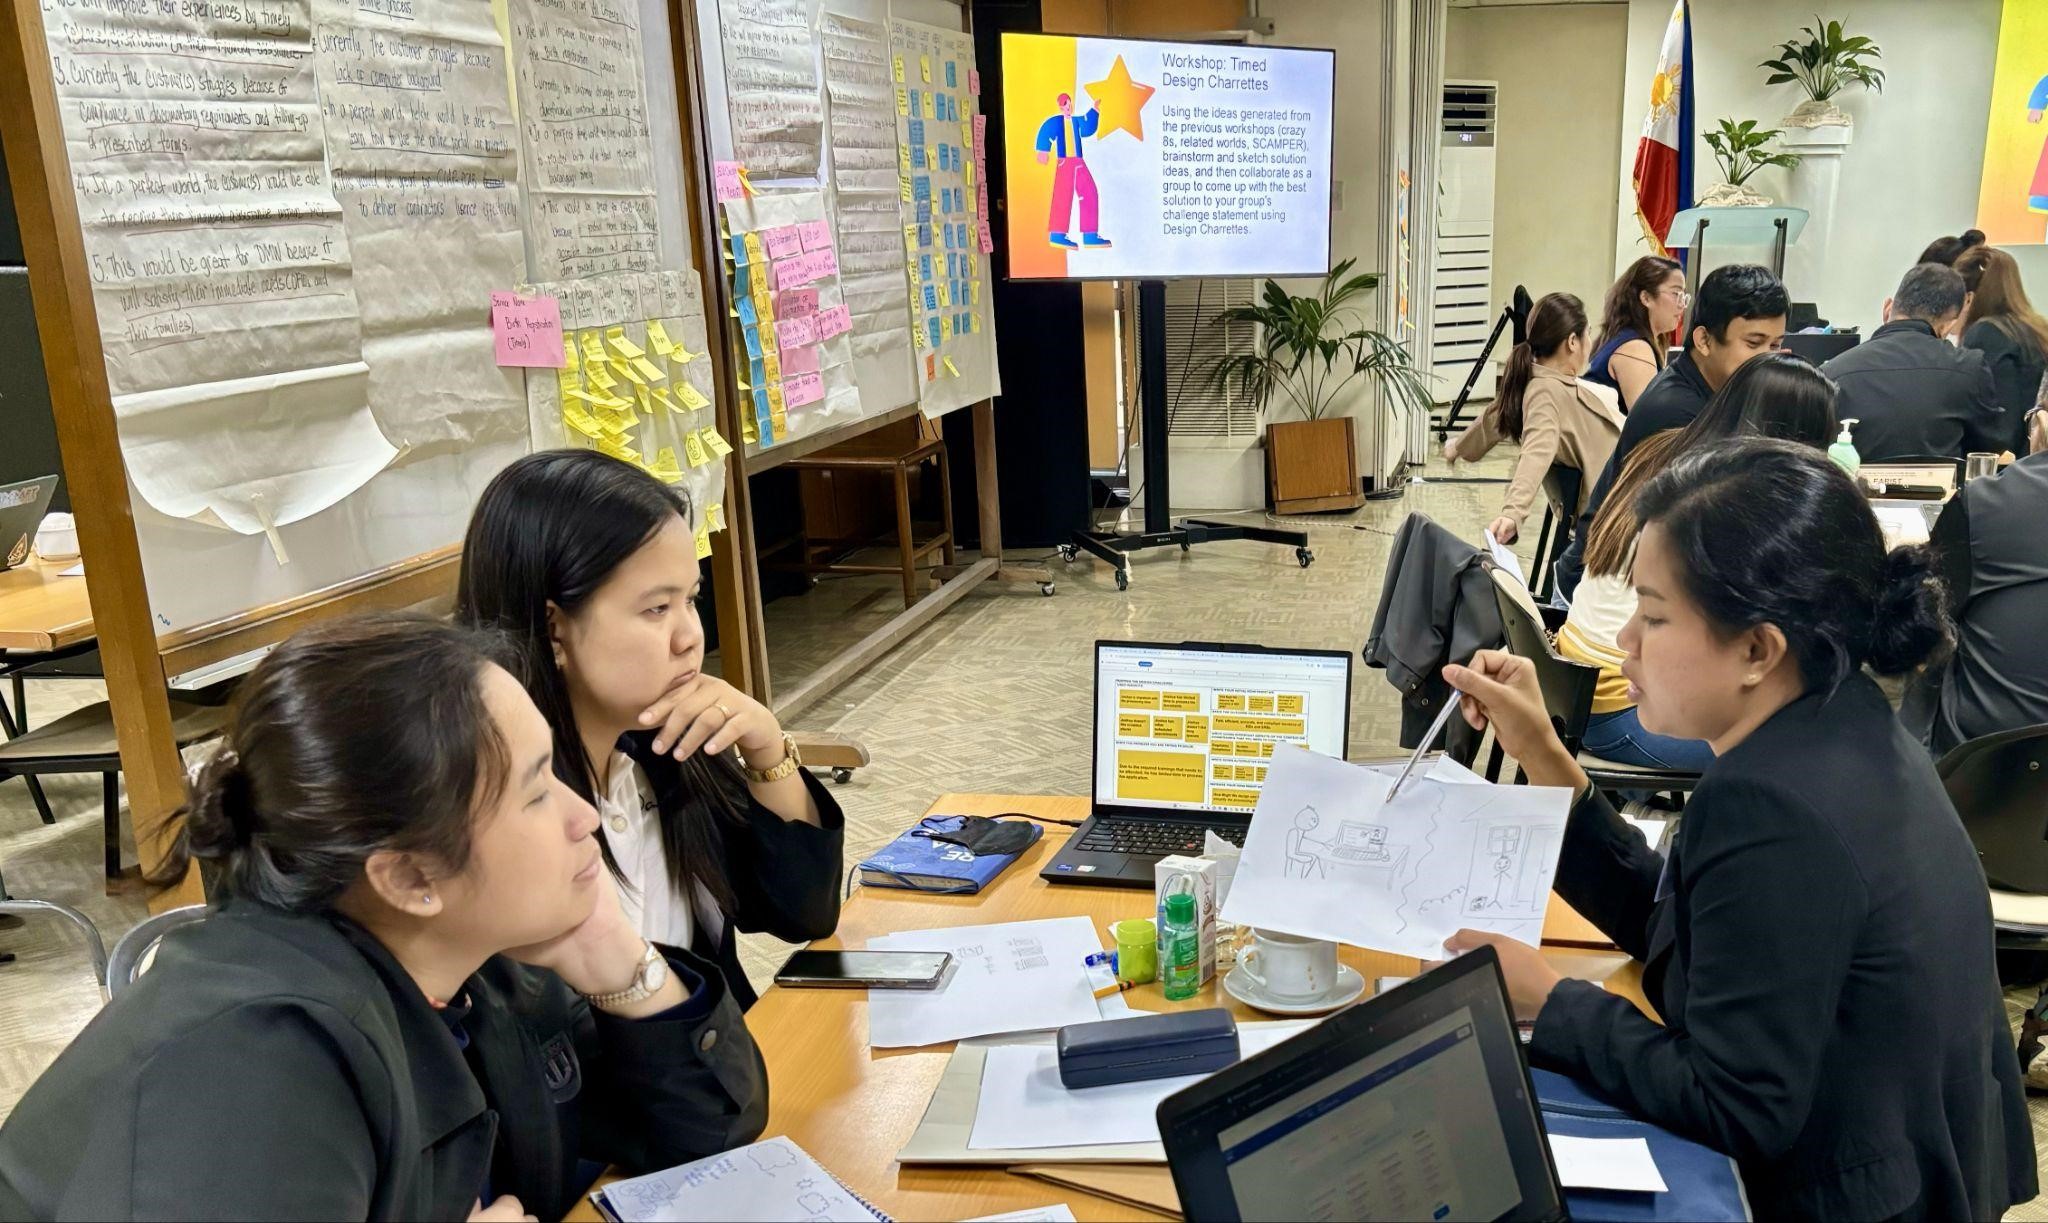
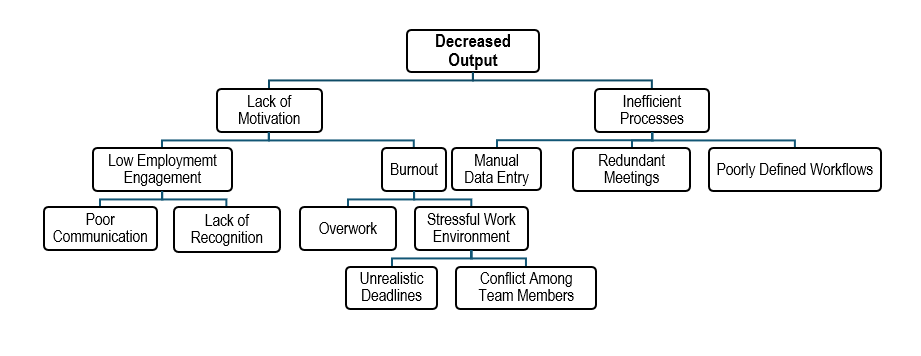
An affinity diagram organizes and categorizes large volumes of data, ideas, or insights by grouping them based on natural relationships. Typically, participants write down ideas on sticky notes and then work together to sort these notes into clusters that represent common themes or concepts. This method is especially useful for organizing ideas generated during brainstorming or ideation sessions, helping to identify patterns and structure in complex information.
Purpose: Synthesizing of ideas
Estimated Time Needed: 15 minutes
Target Participants or Users: Change Managers, Program Managers, Operations Managers, Planning Officers, Process Planners, Service Designers
How to Use the Tool
Steps:
- After brainstorming and ideation sessions, each team should group similar ideas. As each person adds notes on the board, one team member will group ideas into themes. Make sure the board also has a “Miscellaneous” section for notes that do not seem to fit with other themes. Use lines to connect related groups and combine clusters to create super groups if necessary.
- Ask each group to place a creative title on top of each category to summarize its contents.
- Team members are also encouraged to build on each new idea added to the board.
- Share and discuss clustered ideas as a group.
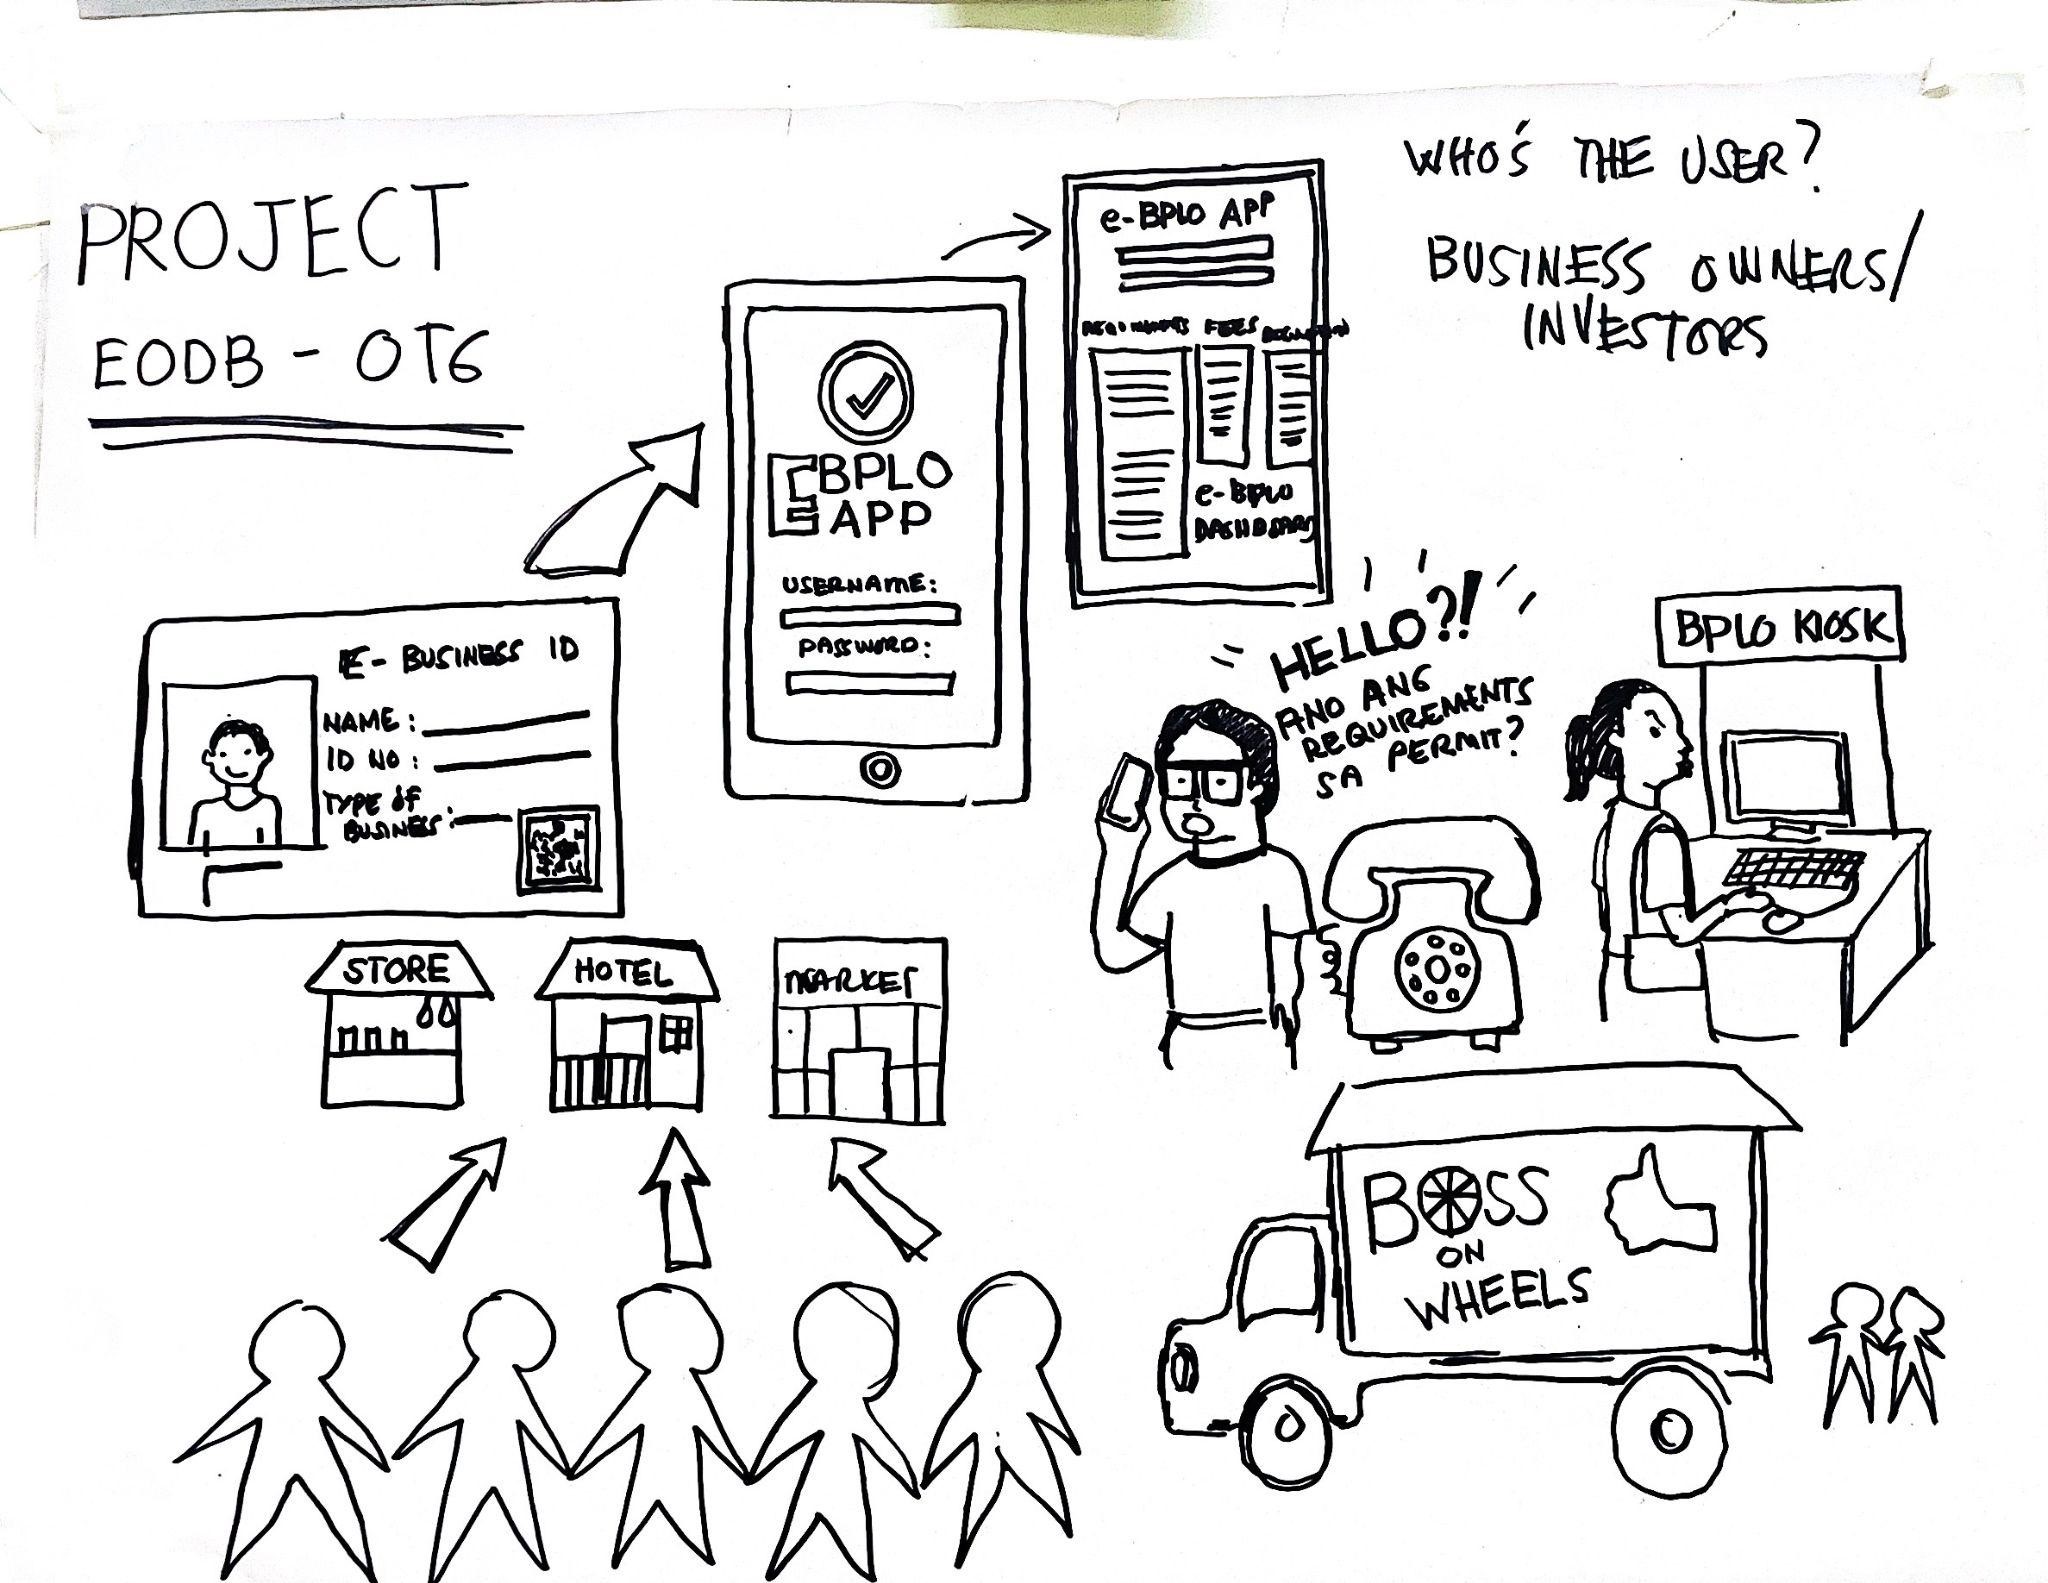
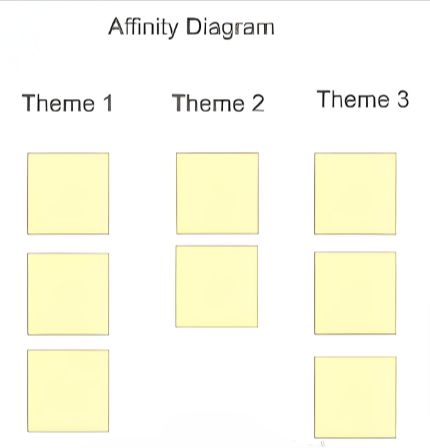
Sample Affinity Diagram Template
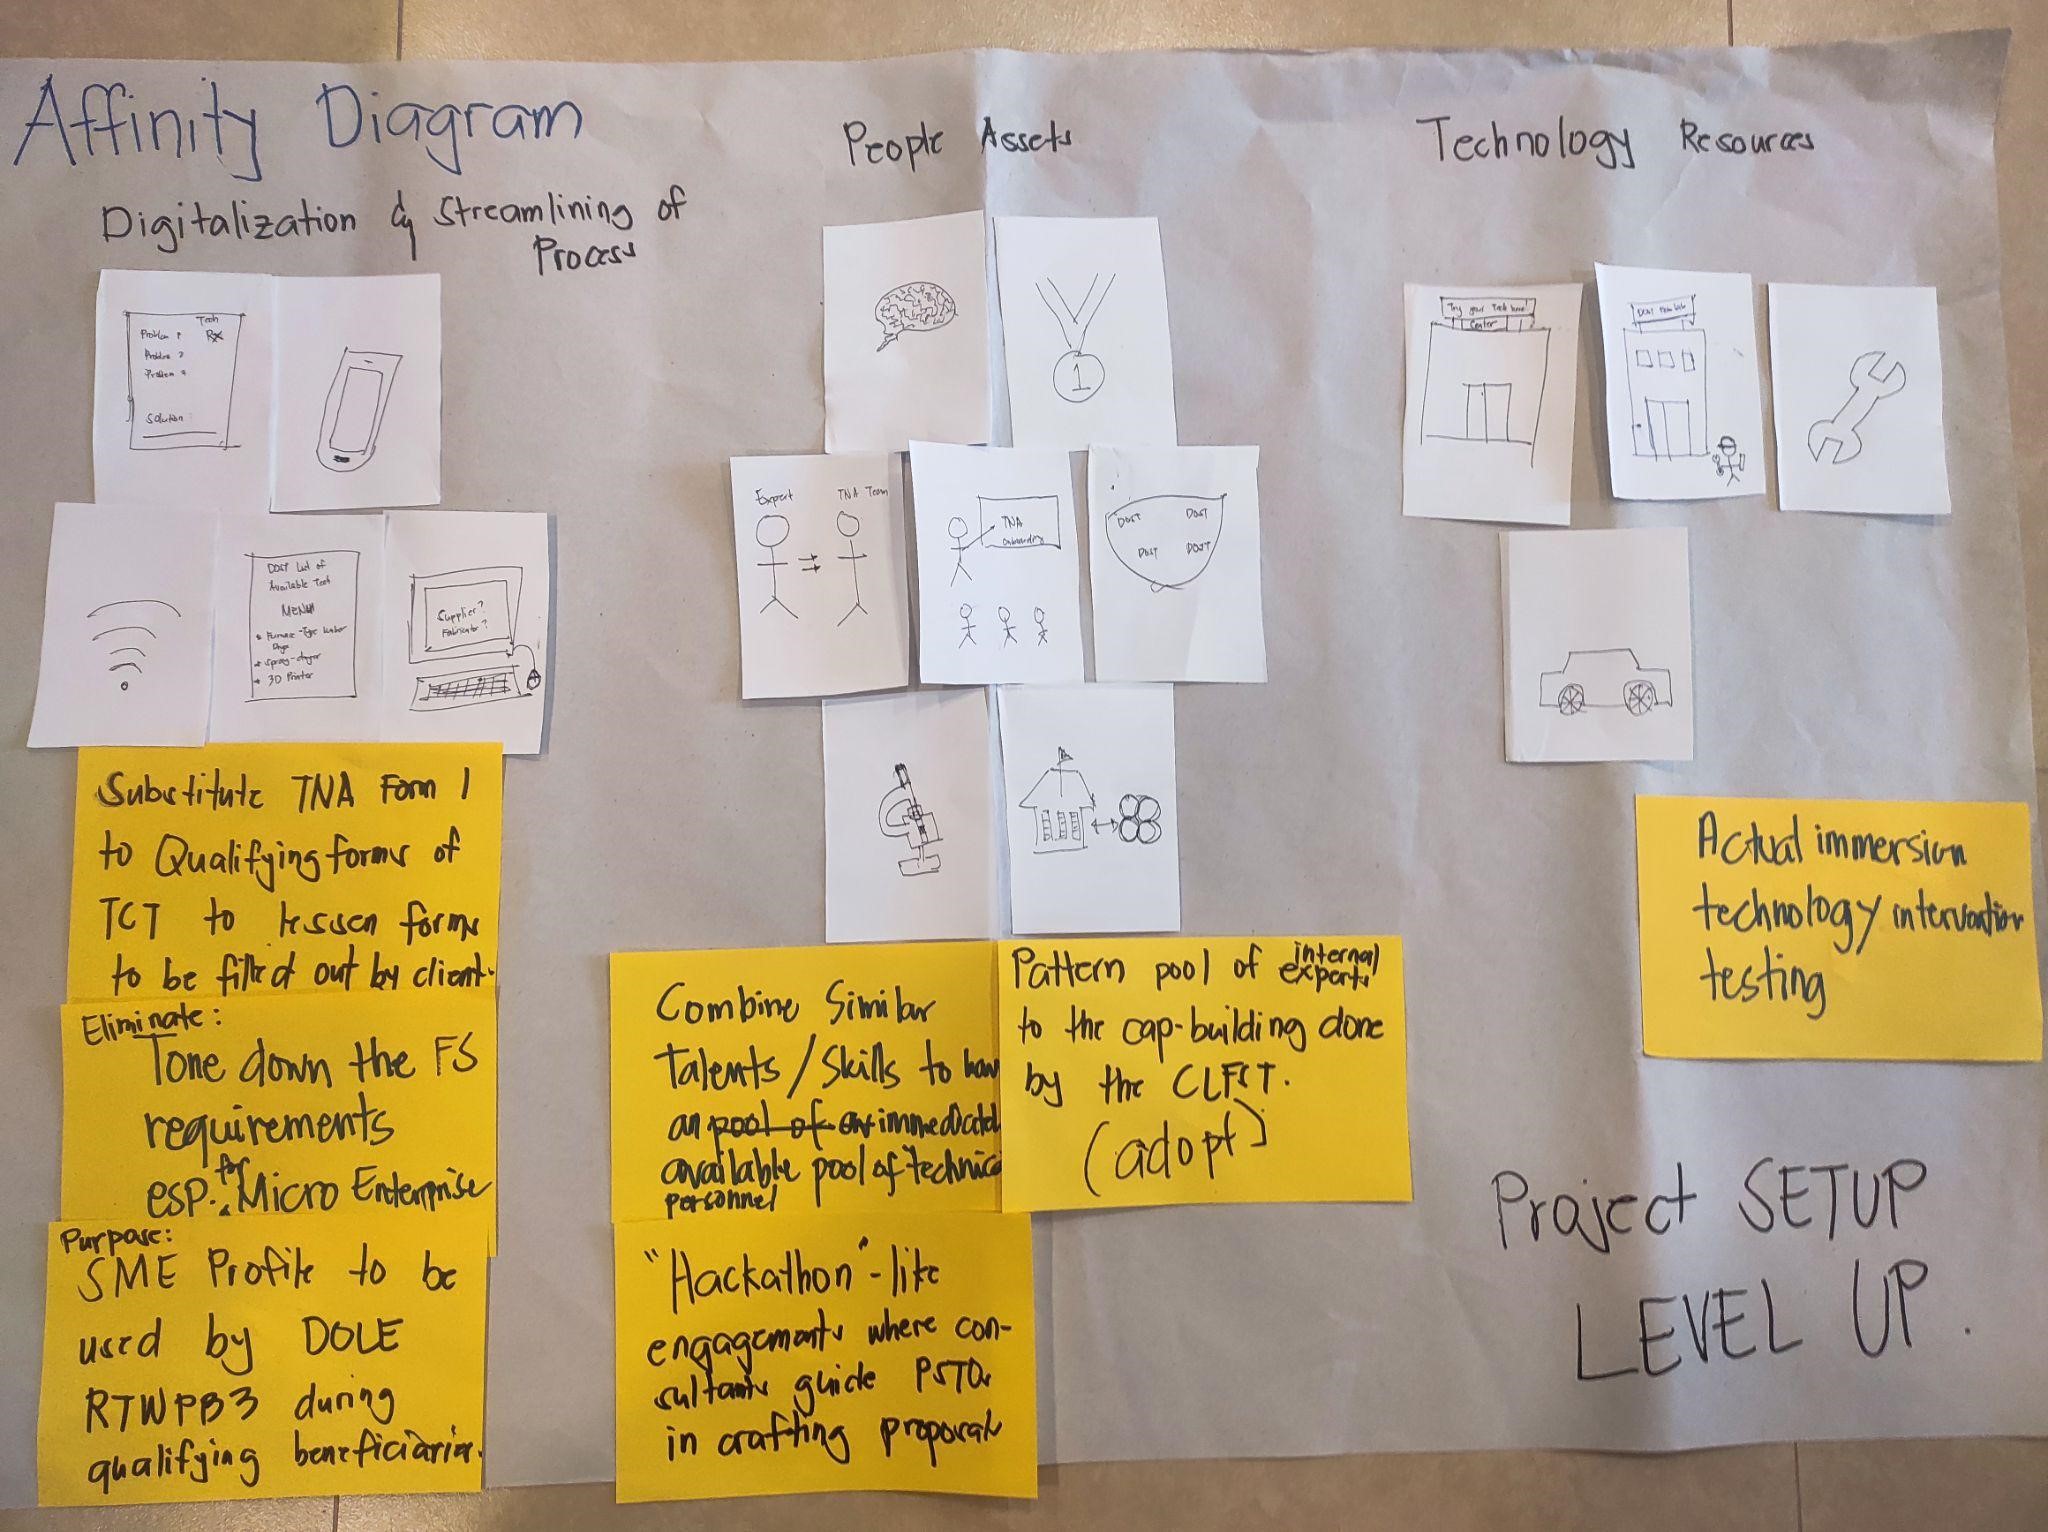
Sample Affinity Diagram Activity Output
| Dam, R. F. and Teo, Y. S. (2022, May 2). Affinity Diagrams: How to Cluster Your Ideas and Reveal Insights. Interaction Design Foundation – IxDF. https://www.interaction-design.org/literature/article/affinity-diagrams-learn-how-to-cluster-and-bundle-ideas-and-facts |