Target Participants or Users: Project Managers, Planning Officers, Financial and Management Officers, Budget Analysts, Community Development Officers, Local Government Operations Officers
About the Tool
A solution prioritization matrix is a strategic management tool that helps public sector organizations make informed decisions about which problems or initiatives to handle first. This systematic approach ensures efficient resource allocation and maximum impact in government operations. The solution prioritization matrix emerged from the quality management movement of the 1960s and 1970s, particularly within the framework of Total Quality Management (TQM). While no single individual can be credited with its invention, the tool evolved from various decision-making methodologies developed in Japan and later refined in Western management practices.
A solution prioritization matrix is a strategic
management tool that helps public sector organizations make informed decisions
about which problems or initiatives to handle first. This systematic approach
ensures efficient resource allocation and maximum impact in government
operations. The solution prioritization matrix emerged from the quality
management movement of the 1960s and 1970s, particularly within the framework
of Total Quality Management (TQM). While no single individual can be credited
with its invention, the tool evolved from various decision-making methodologies
developed in Japan and later refined in Western management practices.
In the public sector, solution prioritization matrices are particularly valuable due to limited resources and multiple competing priorities. They help managers and employees objectively evaluate various initiatives or options based on weighted criteria, leading to more transparent decision-making processes. The benefits include improved resource allocation, enhanced stakeholder buy-in, and better alignment with organizational objectives. Government agencies commonly use this tool for policy implementation, program development, and service delivery optimization. This adaptable tool works for various priority-setting needs and enables teamwork by encouraging discussion and consensus, especially in local government units (LGUs).
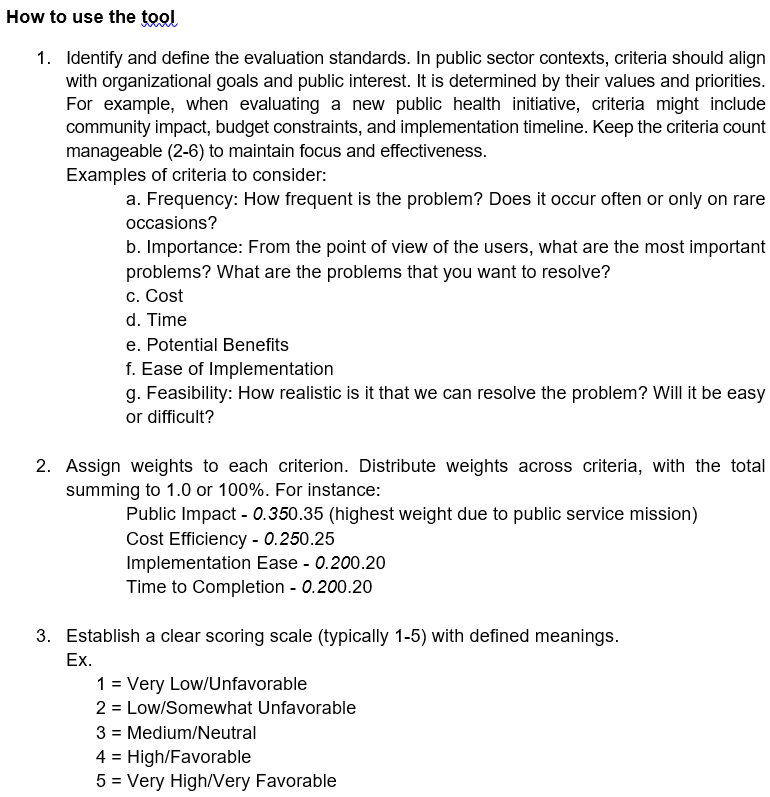
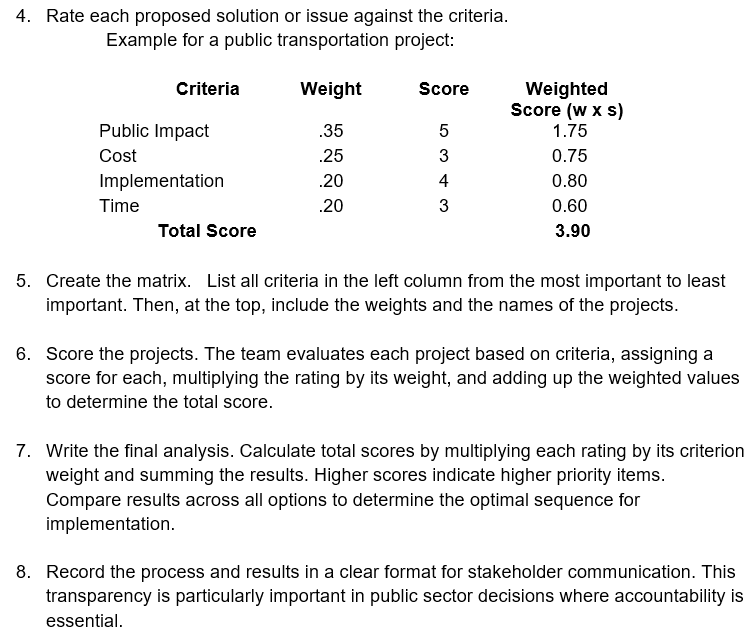
How to use the tool
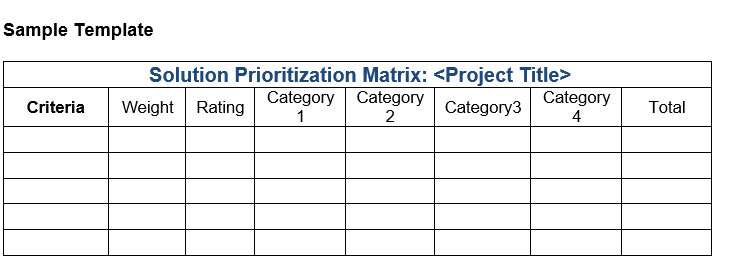
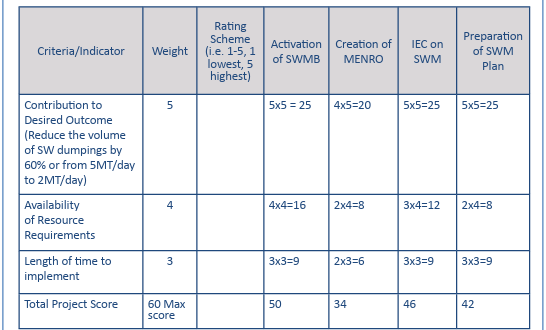
Sample SOLUTIUON PRIORITIZATION MATRIX
Source: Local Government Academy. https://lga.gov.ph/uploads/publication/attachments/1590501045.pdf
Hessing,
T. (n.d.) Project Priority Matrix (Prioritization Matrix). Six sigma study
guide. https://sixsigmastudyguide.com/project-prioritization-matrix/
Purpose: Cost Control, Project Development and Evaluation, Efficient Resource Allocation
Target Participants or Users: Project Managers, Procurement Officers, Budget Officers and Policy Analysts, Engineers and Architects, Planning Officers
About the Tool
Value analysis is a structured technique used to identify and improve the “value” of a project by examining its functions. The process focuses on achieving the required performance at the lowest possible cost without compromising quality or reliability. Originating during World War II in response to resource constraints, the technique was pioneered by Lawrence W. Miles at General Electric. Miles introduced a systematic approach to reassess product functions and eliminate unnecessary costs, a concept that later evolved into what is now known as value engineering. Over the decades, this methodology has been adopted across various industries—including the public sector—to drive efficiency, foster innovation, and improve overall project outcomes. In the Philippine government, VA/VE is aligned with the Republic Act No. 9184 (Government Procurement Reform Act), encouraging cost-effectiveness and efficiency in public projects.
n the Philippines, value analysis (VA), or value engineering (VE) as it is also called, is applied to government undertakings to maximize efficiency and cost effectiveness. The Department of Economy, Planning, and Development (DEPDev) has been a major player in the institutionalization of VA/VE methodologies in different infrastructure projects. For example, DEPDev partnered with SYSTRA Philippines to provide on-the-job training and VE/VA capacity building for infrastructure projects. This partnered training intended to prepare selected representatives from the DEPDev Regional Offices and the Department Public Works and Highways (DPWH) to perform the VE/VA processes as described in the ‘2009 VA Handbook of NEDA’ and as per SAVE International standards. The training was focused on the six phases of job plan – Information, Function Analysis, Creativity, Evaluation, Development, and Presentation – covering all aspects of project assessment and improvement. This effort demonstrates the government’s resolve to adopt VE/VA practices in achieving efficient management of projects and resources.
Benefits
of Value Analysis in the Public Sector
Cost Reduction without Sacrificing Quality – VA systematically identifies unnecessary costs in government projects and services, ensuring that expenditures align with essential functions and public needs.
Improved Resource Utilization – By analyzing functions and alternatives, VA helps government agencies maximize limited resources, reducing waste and redundancy.
Enhanced Service Delivery – VA leads to process improvements that result in faster, more effective, and higher-quality public services for citizens.
Transparency and Accountability – The structured approach of VA promotes evidence-based decision-making, reducing inefficiencies and increasing public trust in government expenditures.
Innovation and Creativity – By encouraging alternative solutions and brainstorming, VA fosters innovative approaches to public sector challenges, leading to better project outcomes.
Sustainability and Environmental Benefits – VA encourages eco-friendly and sustainable options by considering the long-term impacts of government projects.
Risk Reduction – By thoroughly analyzing functions and alternatives, VA helps identify potential risks in projects and mitigates them before implementation.
Faster Project Implementation – VA streamlines project planning and execution by eliminating unnecessary processes, leading to quicker completion of government initiatives.
How to use the Technique
Phases of Value Methodology
Value Analysis principles consist of key questions, techniques, and procedural tasks used in pursuing the objective of the value analysis job plan. The objective is to achieve design excellence by completing each of the following phases:
1. Information Phase The objective of the information phase is to acquire knowledge of the design to be studied and to assess its major functions, cost, and relative worth. In this phase, there are three important actions to take to fully understand the value analysis study that needs to be done: (1) gather all types of information, (2) get the facts, and (3) get all available costs.
2. Creativity Phase The objective of the creativity phase is to “brainstorm” the functions of the design elements identified in the information phase and develop an alternative to each. There are several techniques available for use during the creativity phase. Some commonly used techniques are free association techniques and brainstorming.
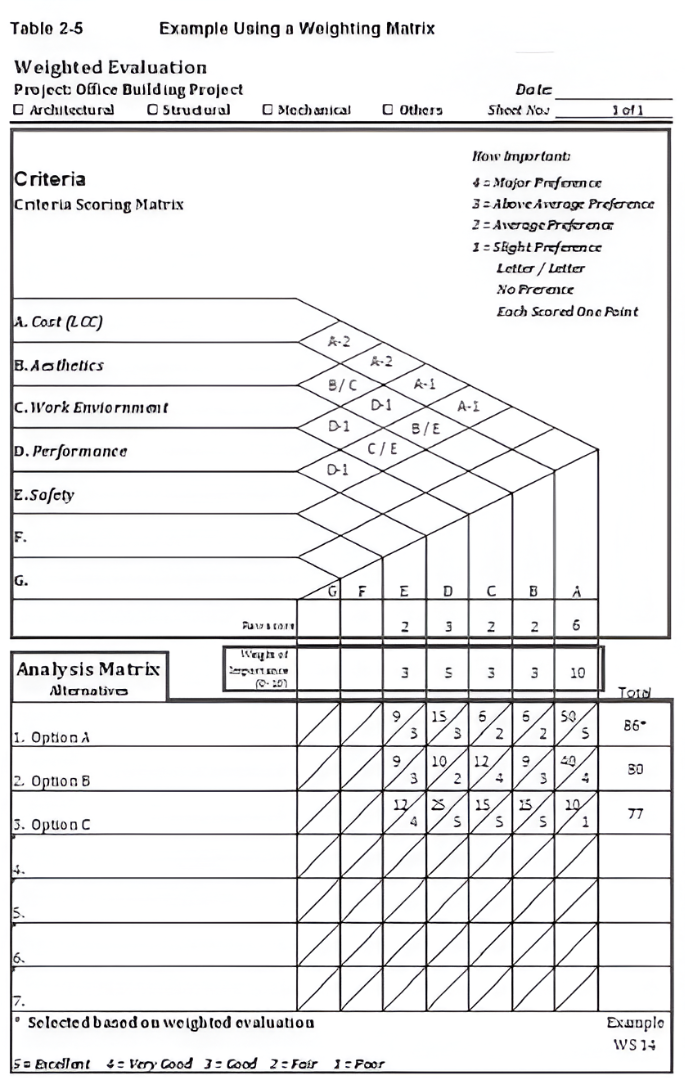
3. Evaluation Phase The objective of the evaluation phase is to analyze the results of the creativity phase and thoroughly review the various alternatives, select the best ideas for further expansion. There are several techniques used to evaluate alternate ideas such as advantageous versus disadvantageous techniques, ranking technique, probabilities technique, and estimating alternatives. Among these, the most common method used for the evaluation process is that of comparing each criterion against the other and assigning a measure of importance. For an actual project, the weighted matrix should incorporate the project’s actual data.
Sample Weighted Matrix Source: DPWH Guidelines On Value Engineering (2015)
4. Development Phase The objective of the development phase is to collect additional data, analyze thoroughly the best alternatives selected during the evaluation phase, and prepare cost estimates and initial designs that will ensure acceptability and ultimate project implementation. In this phase, the most promising alternatives selected during the evaluation phase will be further developed into detailed alternatives. There are also several techniques which could be used in the development phase. Some of these are search techniques, consideration of alternate products and materials, and consulting specialists and suppliers.
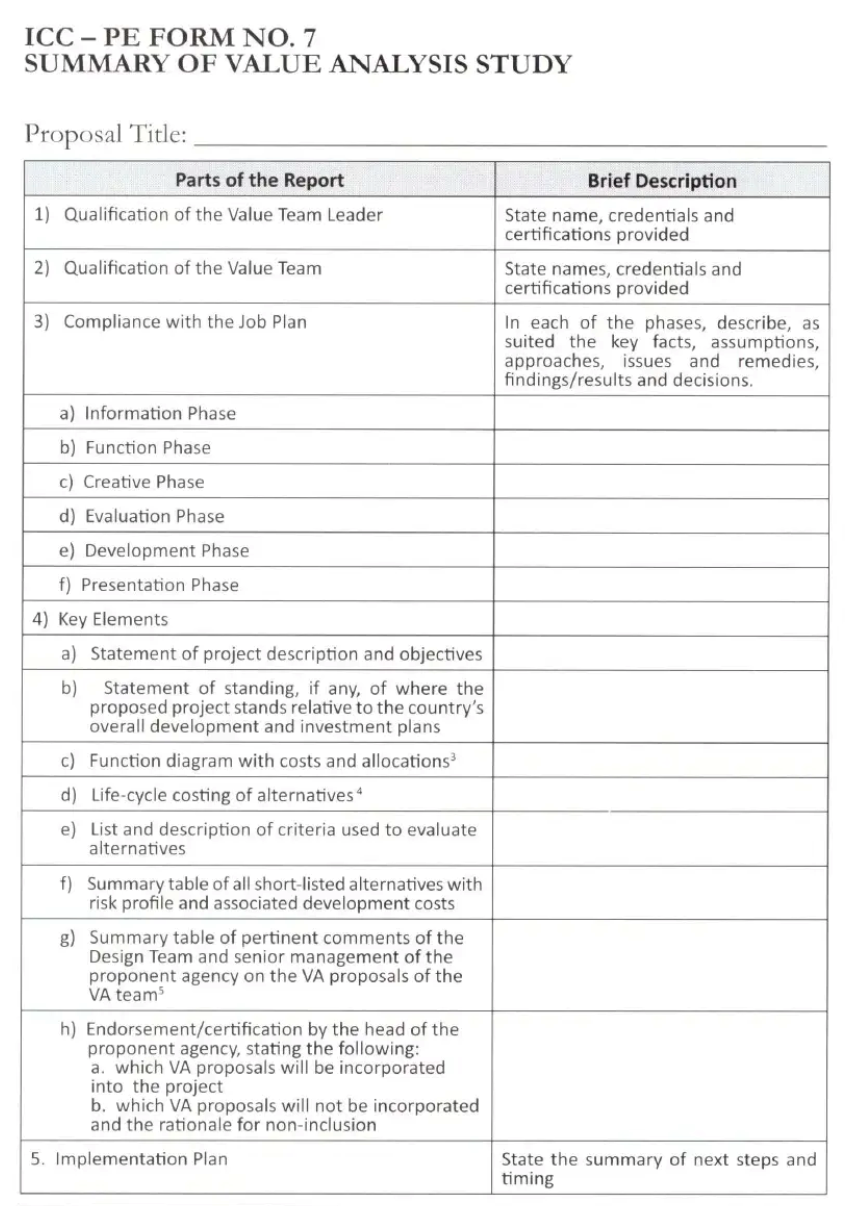
5. Presentation Phase The objective of the presentation phase is to put the recommendations before the decision-makers with sufficient information that the decision-makers will accept the proposal. The initial presentation of a recommendation must be concise, factual, accurate and conducted in a manner that creates management’s desire to implement the change.
6. Implementation Phase The objective of the implementation phase is to ensure that the approved proposals are rapidly and properly translated into action to achieve savings or project improvements that were proposed.
DPWH (2015). DPWH Guidelines on Value Engineering. https://www.scribd.com/document/340671363/DPWH-Guidelines-on-Value-Engineering-pdf
Purpose: Process Efficiency, Process Improvement,
Problem Solving, Service Improvement
Target Participants or Users: Program
Managers, Program Directors, Superintendents, Safety Officers, Chief
Inspectors, Supervisors, Operation Officers, Maintenance Chiefs
About the Technique
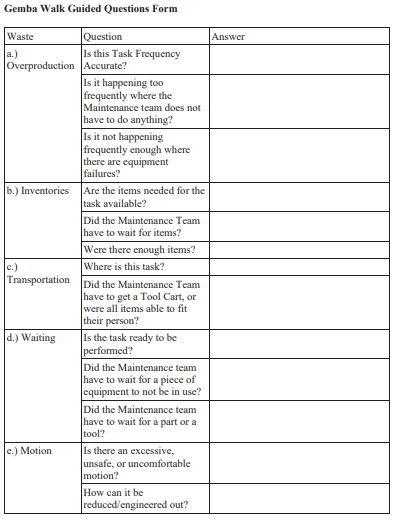
A Gemba Walk is a key
lean management technique where leaders go to the actual place where work
happens to understand processes, identify waste, and find opportunities for
improvement.
The term “Gemba
Walk” originates from the Japanese phrase “Gemba,” which means
“the real place.” It is a
structured, firsthand observation of work processes within their actual
setting. This methodology is meticulously designed to provide a better
understanding of current operational conditions and to identify opportunities
for substantial improvements. The core
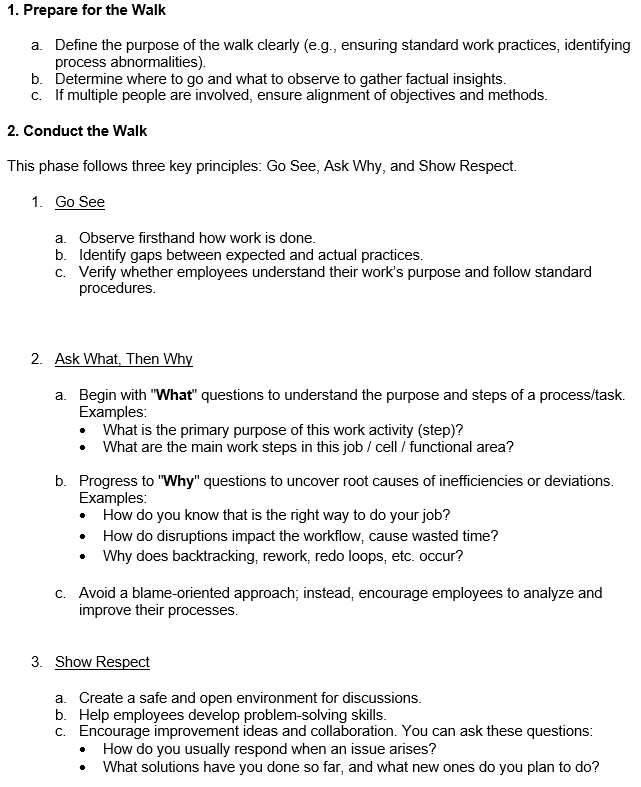
principle behind Gemba Walks is: “Go See, Ask Why, Show Respect.” This involves directly observing processes,
inquisitively exploring the underlying reasons behind observations, and
demonstrating genuine respect for the individuals performing the work.
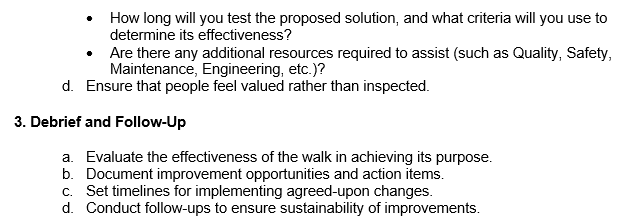
Gemba Walk enhances efficiency across various public sector settings. In municipal offices, they help identify inefficiencies in public services like licensing and tax collection. Healthcare facilities use them to optimize patient flow and reduce wait times, improving service quality. Law enforcement agencies benefit by refining administrative and field operations to enhance safety and efficiency. Educational institutions improve student services and administrative workflows through Gemba Walks, leading to better educational outcomes. Public works and transportation departments apply them to assess road maintenance, public transit, and infrastructure projects, ensuring resource optimization and improved service delivery.
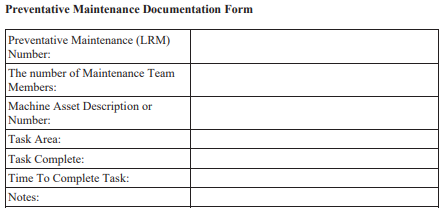
Taylor,
J.D. (2021). The Impact of Gemba Walks on Preventative Maintenance
Productivity. [(Masters Thesis), Western Kentucky University]. https://digitalcommons.wku.edu/cgi/viewcontent.cgi?article=4546&context=theses
Target Participants or Users: Maintenance Personnel, Technical Engineers, Asset management Officers, Plant Engineers, Systems Operators, Quality Assurance Officers, Facility Engineers, Project Engineers, Planning Officers, District Engineers
About the Technique
Total Productive
Maintenance (TPM) is a comprehensive approach to equipment maintenance that
aims to achieve no breakdowns, slowdowns, or defects. The concept of TPM was developed
in Japan during the 1970s. Companies realized that inefficiencies in
maintenance practices were costly, prompting the establishment of TPM as a
strategy to enhance productivity and as a response to global competition.
Initially, maintenance was viewed as a reactive process, addressing problems
only after they occurred. This changed with TPM, which emphasizes preventive
and predictive maintenance, involving all employees in the maintenance process
to contribute to a culture of continuous improvement.
TPM allows employees to take responsibility for
the upkeep of their equipment, which can lead to increased job satisfaction and
engagement. Employees develop skills in basic maintenance and are encouraged to
identify potential issues before they escalate into major problems. For
managers, TPM helps reduce operational costs by improving equipment reliability
and efficiency. This leads to higher production levels and better-quality
products.
One important metric in TPM is Overall Equipment Effectiveness (OEE), calculated using the following formula:
OEE = Availability x Performance x Quality Availability = Actual Operating Time / Planned Production Time Planned Production Time = Office Operating Hours – Planned Shut Down Time Where: • Planned Shut Down are periods when not scheduled (required) to use (e.g. weekends, off-shifts, breaks, lunch, etc). Note: If you’re scheduled to run during breaks and lunches, this is not considered Planned Shutdown Time. Quality = Good Output / Total Output Where:Total Output: The entire volume of equipment produced, procured, maintained, or serviced, regardless of condition or compliance. It includes all units acquired or handled during operations whether fully operational, defective, requiring repair, set aside for testing, or decommissioned during upgrades or asset transitions.Good Output: The equipment units that are fully functional, compliant with specifications, and immediately ready for official use without needing repair, adjustment, or rework. These units meet all quality, safety, and performance standards set by the agency or regulatory authorities.
Application in the Public Sector
In the Philippine government, TPM practices are not explicitly specified. However, operational frameworks often include reliability-centered maintenance, continuous improvement programs, and cross-functional team involvement, all of which are fundamental components of TPM. Several government positions and agencies carry out activities aligned with TPM principles. Its application in the public sector involves systematic maintenance routines, efforts to boost efficiency, and strategies to reduce operational disruptions particularly within agencies responsible for managing public assets. For example, public transportation systems such as the Metro Manila Light Rail Transit (LRT) system can implement TPM to ensure their equipment, infrastructure, and trains are well-maintained, leading to fewer breakdowns and delays. By adopting TPM principles, public organizations can improve service delivery and resource management.
Sample Department of Transportation MRT-3 Maintenance Schedule Source: https://www.facebook.com/DOTrPH/posts/pfbid0Zt99rMdsXtmhjpxy67fQkPqMiQaDVi1iefVVFLZcdXF5wL9Xv6Xfq1jdsAMoWVFxl
Sample Metro Manila Development Authority (MMDA) regular maintenance of floodgates pumping stations Source: https://www.facebook.com/MMDAPH/posts/ang-mmda-ay-nagsasagawa-ng-regular-na-maintenance-ng-pumping-stations-at-floodga/915924094037987/
How to Do the Technique
Steps
1. Establish a TPM Team. Form a cross-functional team with representatives from operations, maintenance, and management to lead the TPM initiative. Example: Include IT specialists, maintenance technicians, and supervisors in the team. 2. Train Employees. Provide training on TPM principles and the importance of maintenance responsibilities. Example: Conduct workshops on basic maintenance tasks for maintenance technicians and staff. 3. Define Maintenance Tasks. Identify and document routine maintenance tasks for maintenance technicians to perform. Example: Create checklists for daily inspections of equipment. 4. Implement Preventive Maintenance Schedule. Develop and adhere to a preventive maintenance schedule to reduce unplanned downtime. Example: Schedule regular inspection and cleaning tasks based on equipment usage. 5.Monitor and Measure Performance. Use OEE to track improvements in equipment performance and employee involvement. Example: Calculate OEE monthly to assess the effectiveness of the TPM program. 6. Encourage Continuous Improvement. Allow employees to suggest improvements and take ownership of their equipment. Example: Hold regular meetings to discuss maintenance challenges and successes. 7. Review and Adjust the Program. Periodically review the TPM program and make necessary adjustments based on feedback and performance data. Example: Use performance metrics to identify areas for further training or resources.
References:
Agustiady, T.K. & Cudney, E.A. (2016). Total Productive Maintenance: Strategies and implementation Guide. CRC Press.
Nakajima, S. (1988). Introduction to TPM. Productivity Press.
Saflor, C.S.R. & Noroña, M. I. (2021). Total Productive Maintenance in the Philippine Rice Production Sector. Proceedings of the International Conference on Industrial Engineering and Operations Management Sao Paulo, Brazil. http://www.ieomsociety.org/brazil2020/papers/604.pdf
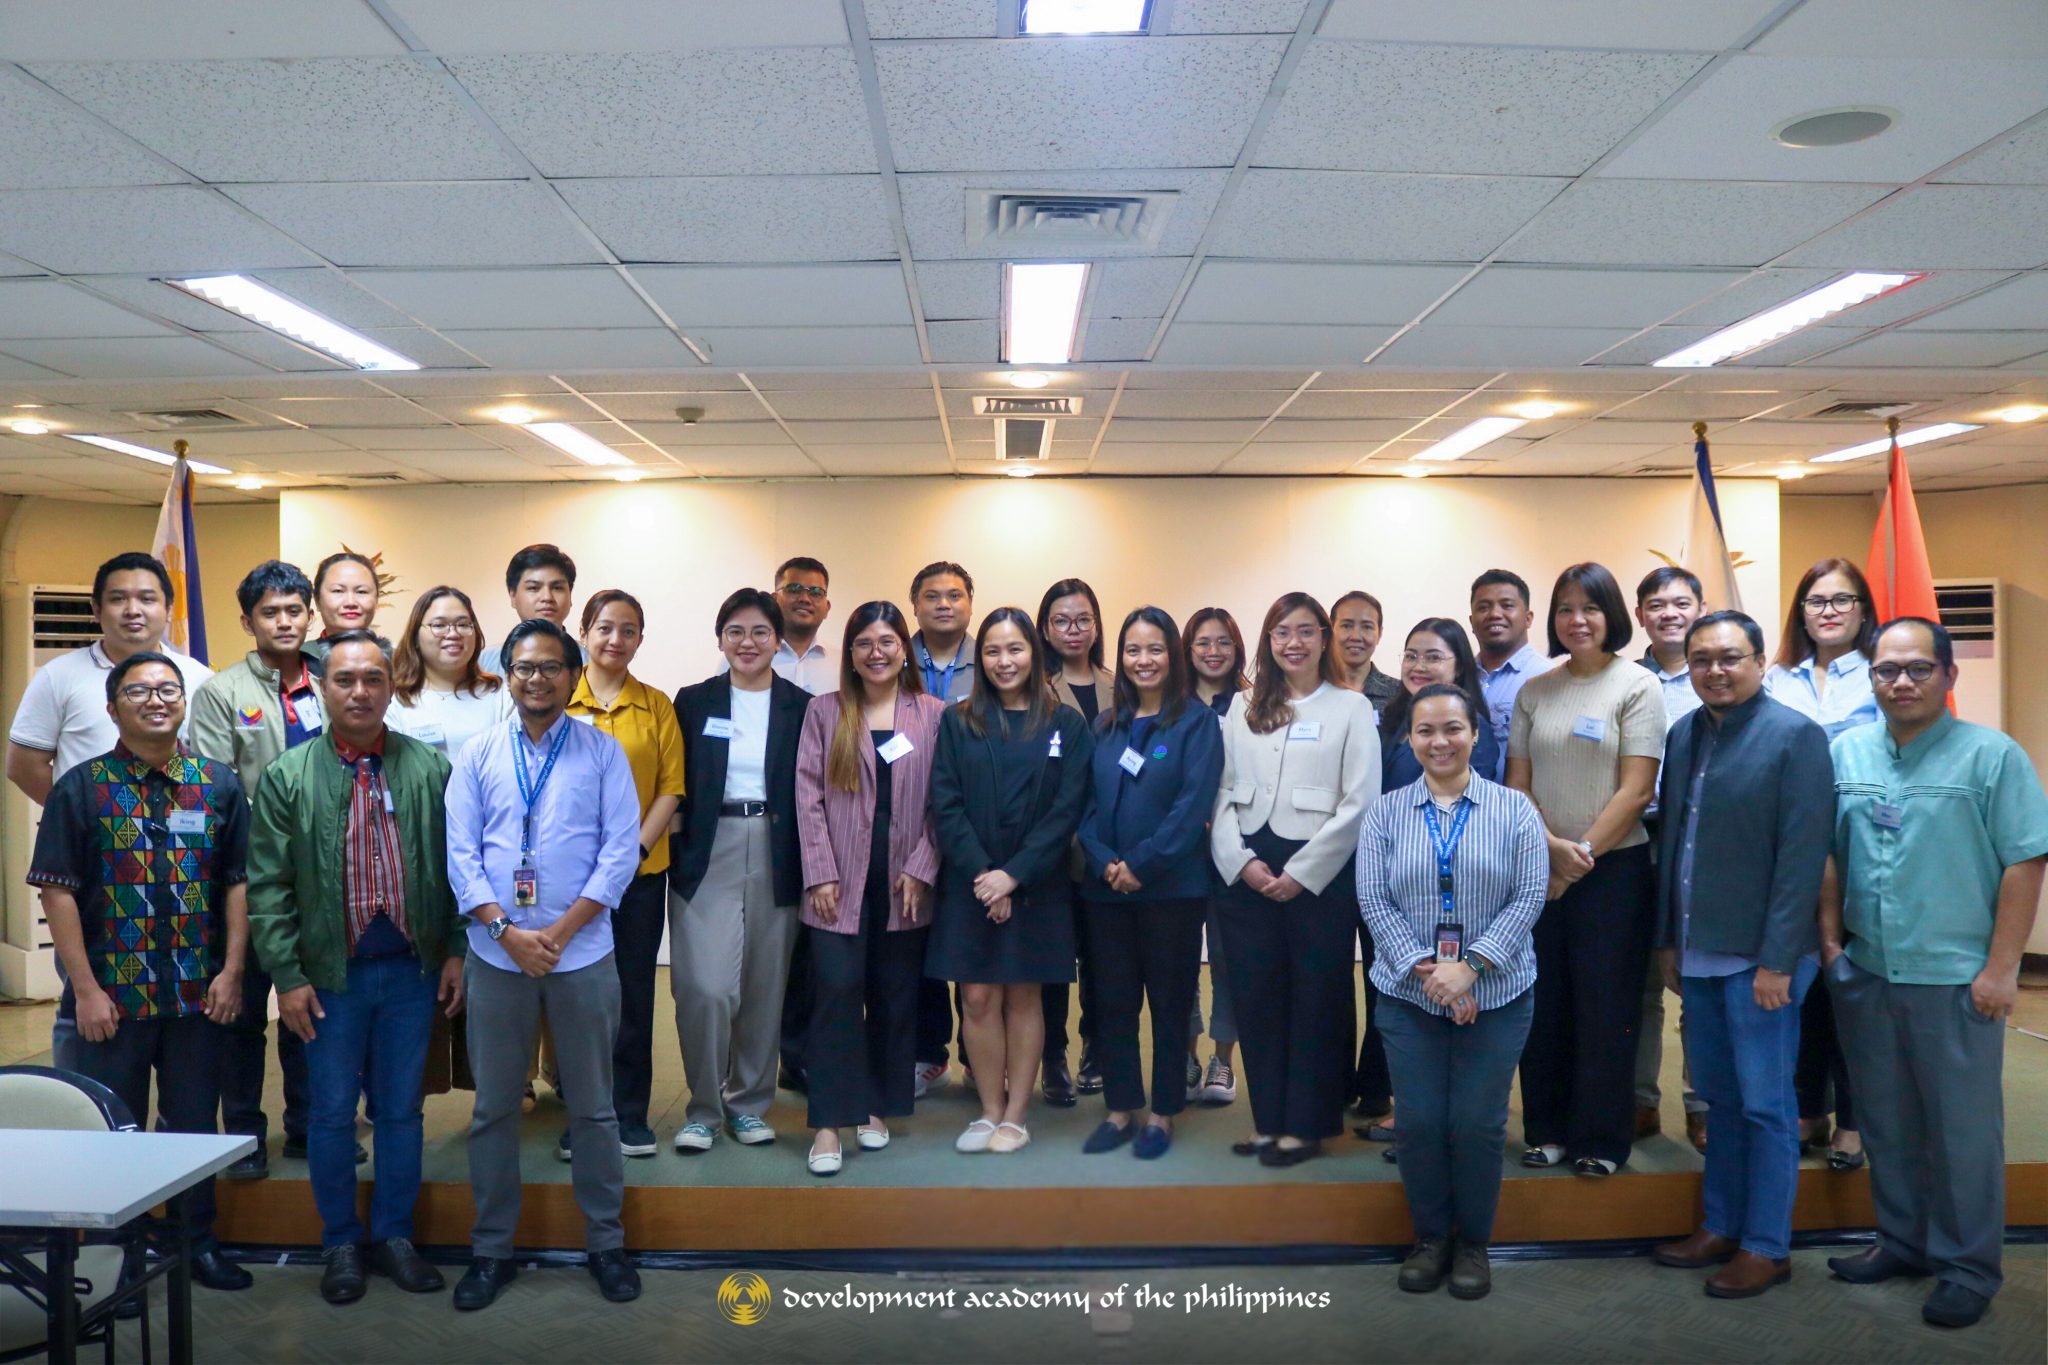
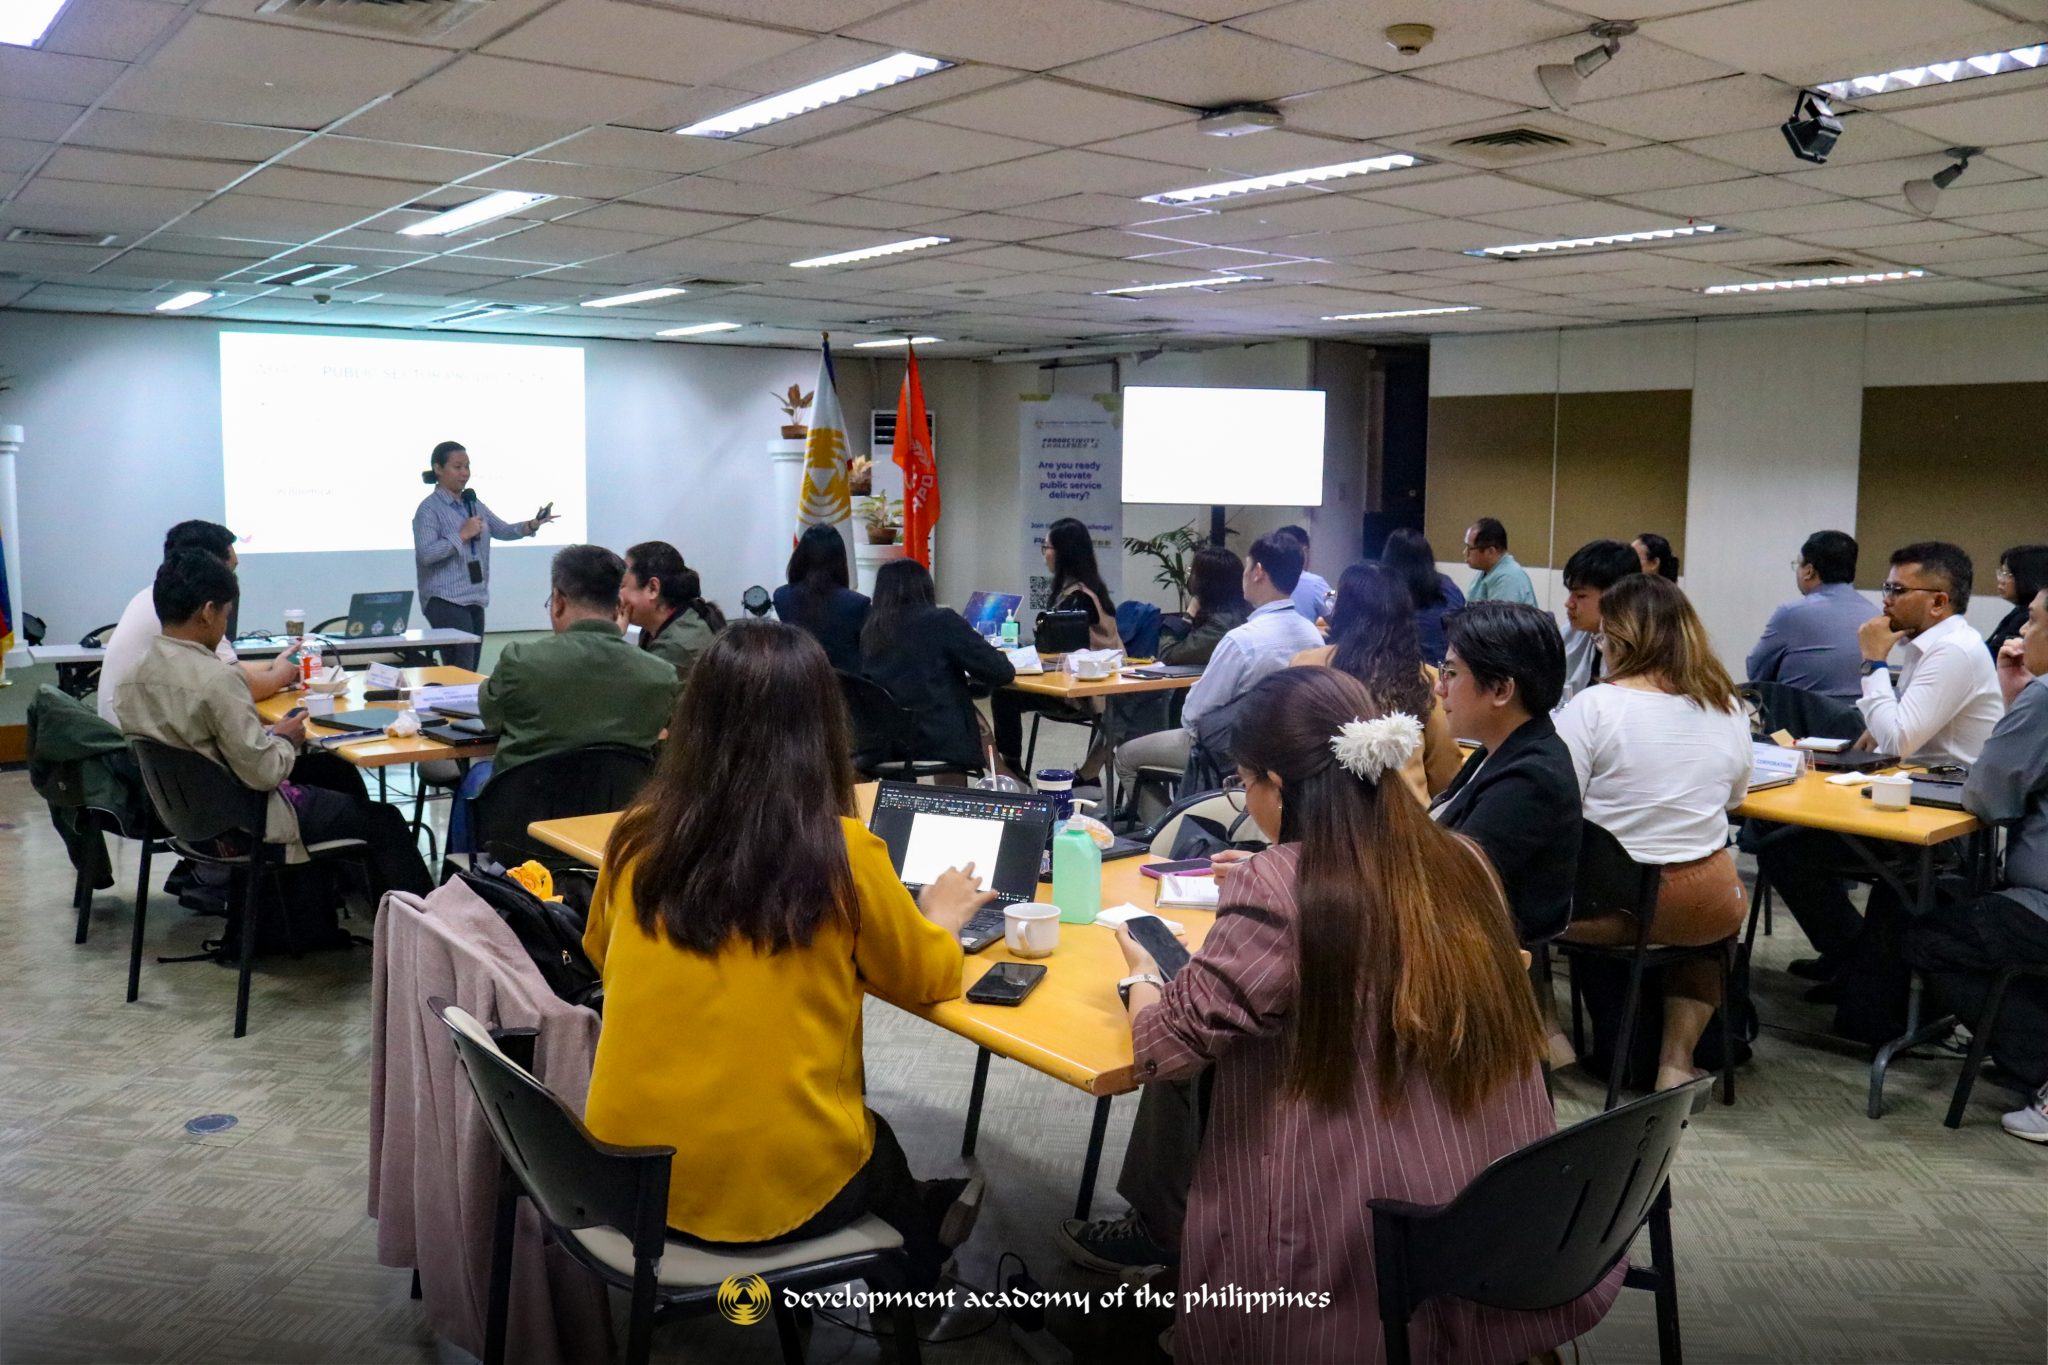
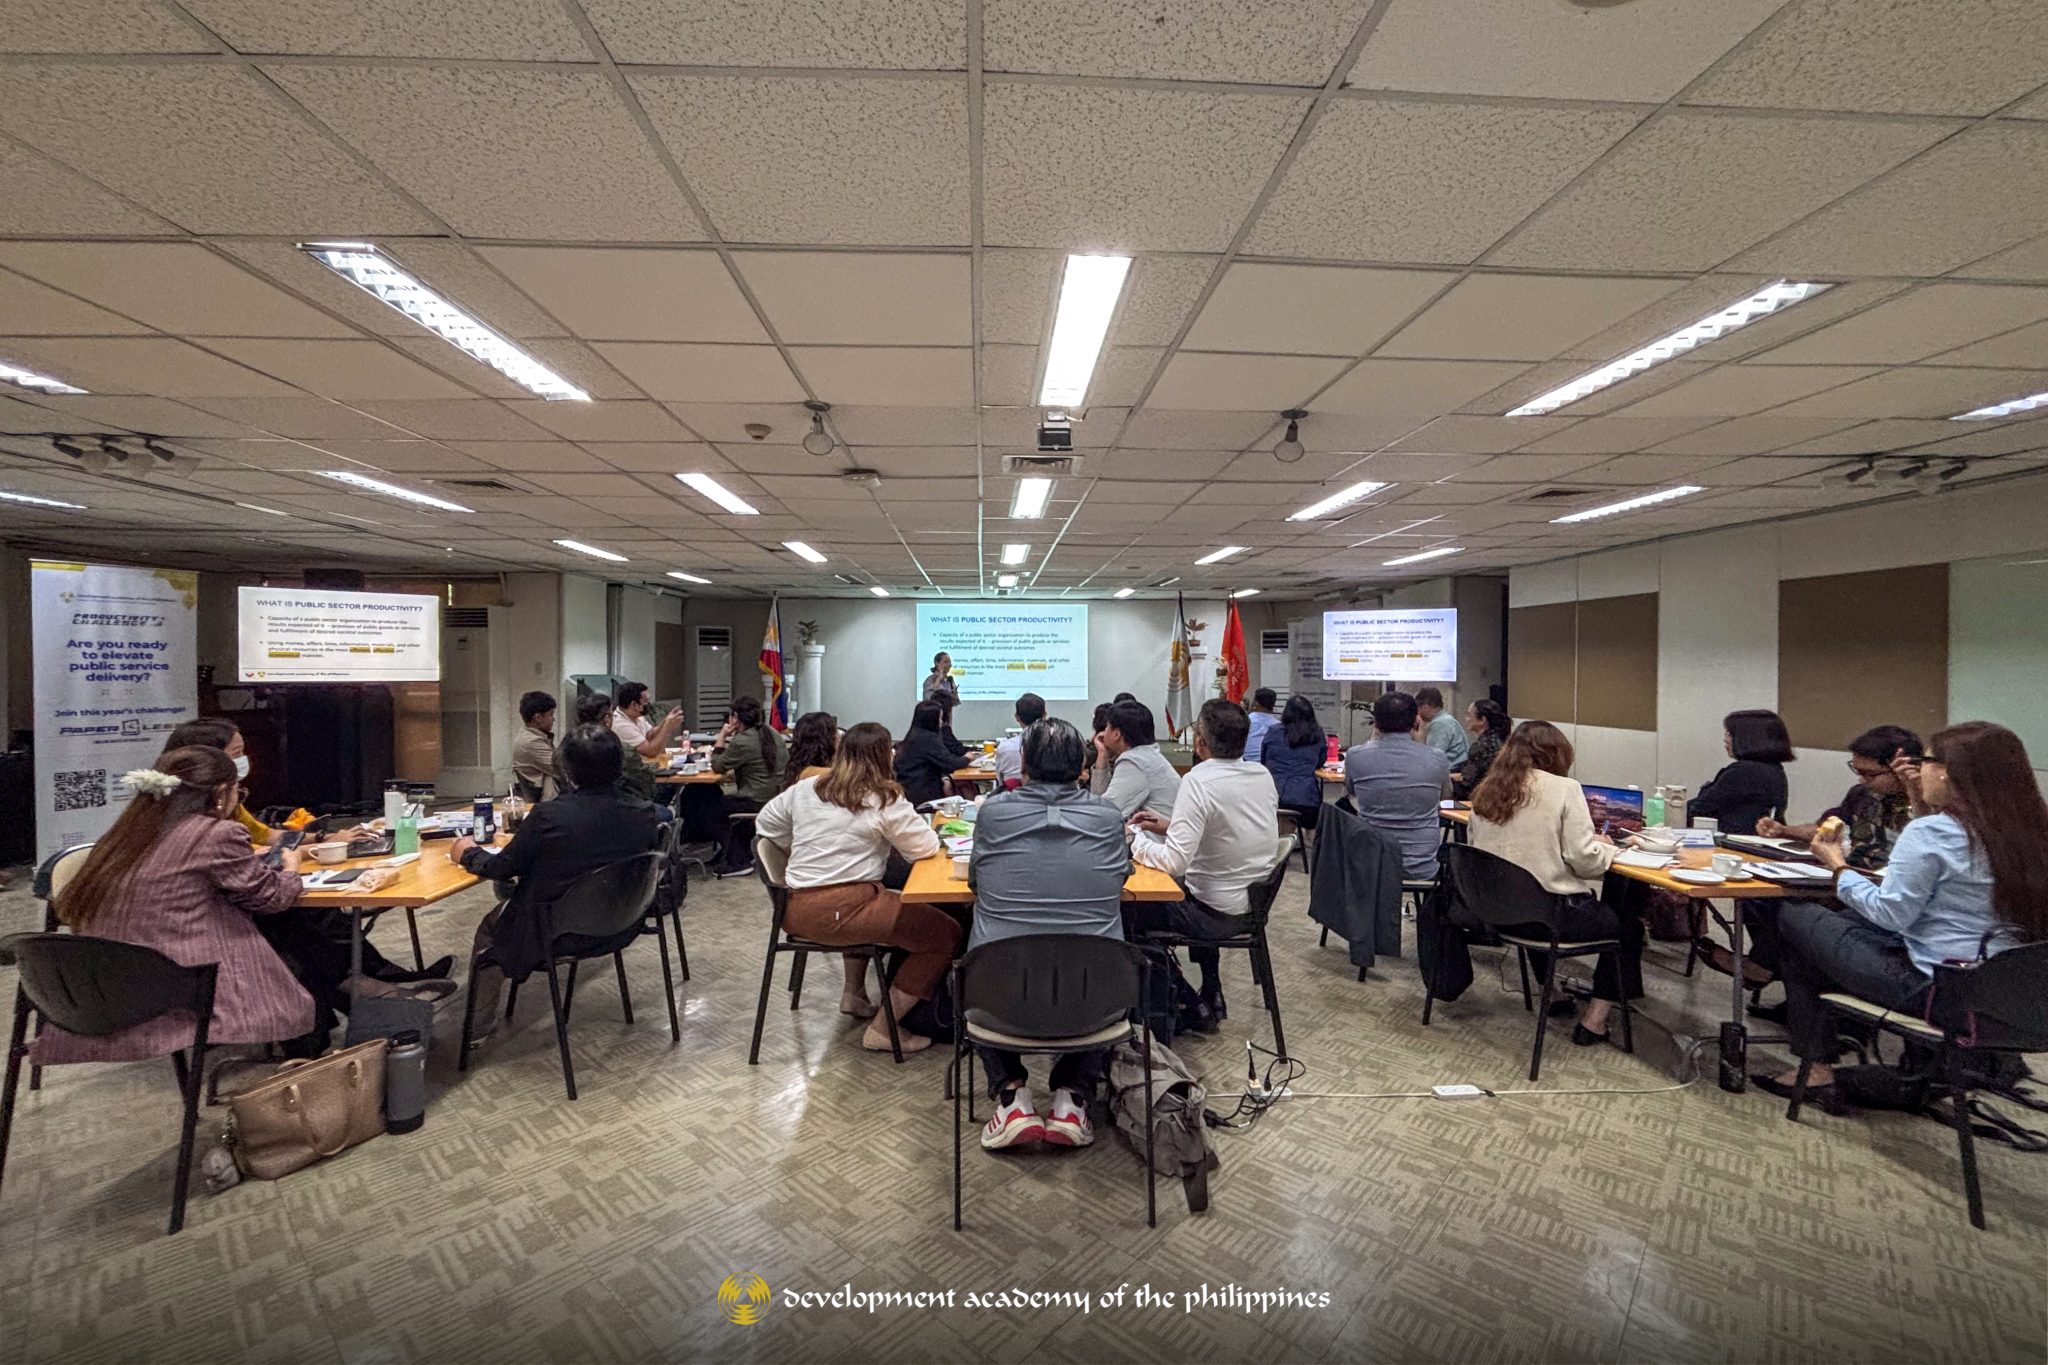
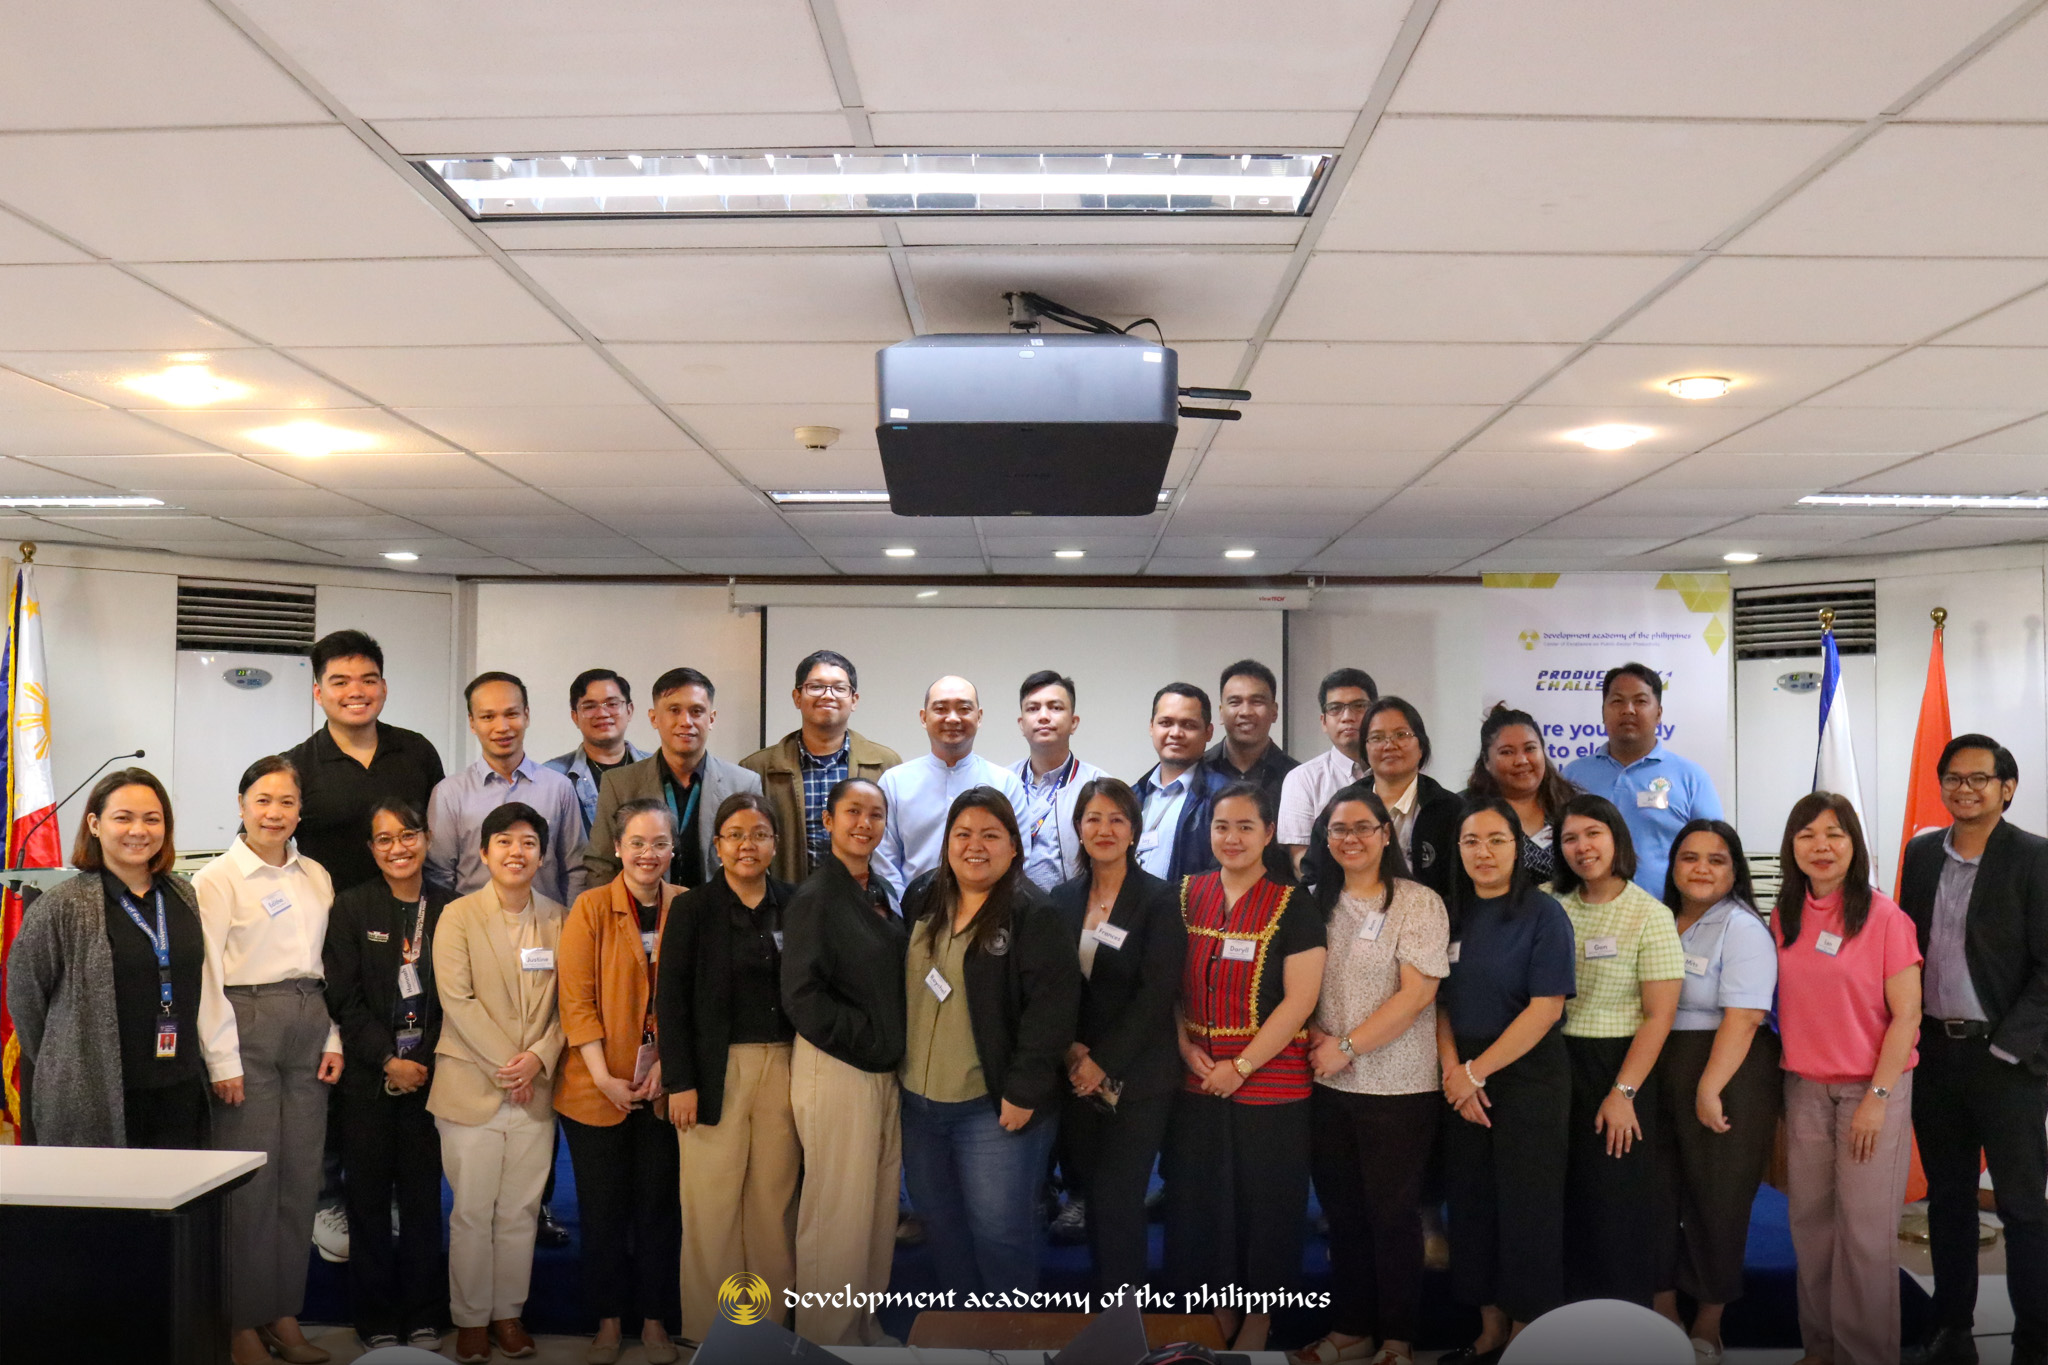
The Development Academy of the Philippines (DAP), as the focal organization for the Asian Productivity Organization’s Center of Excellence on Public-Sector Productivity, successfully completed the third batch of the 2025 Productivity Challenge Workshop Series.
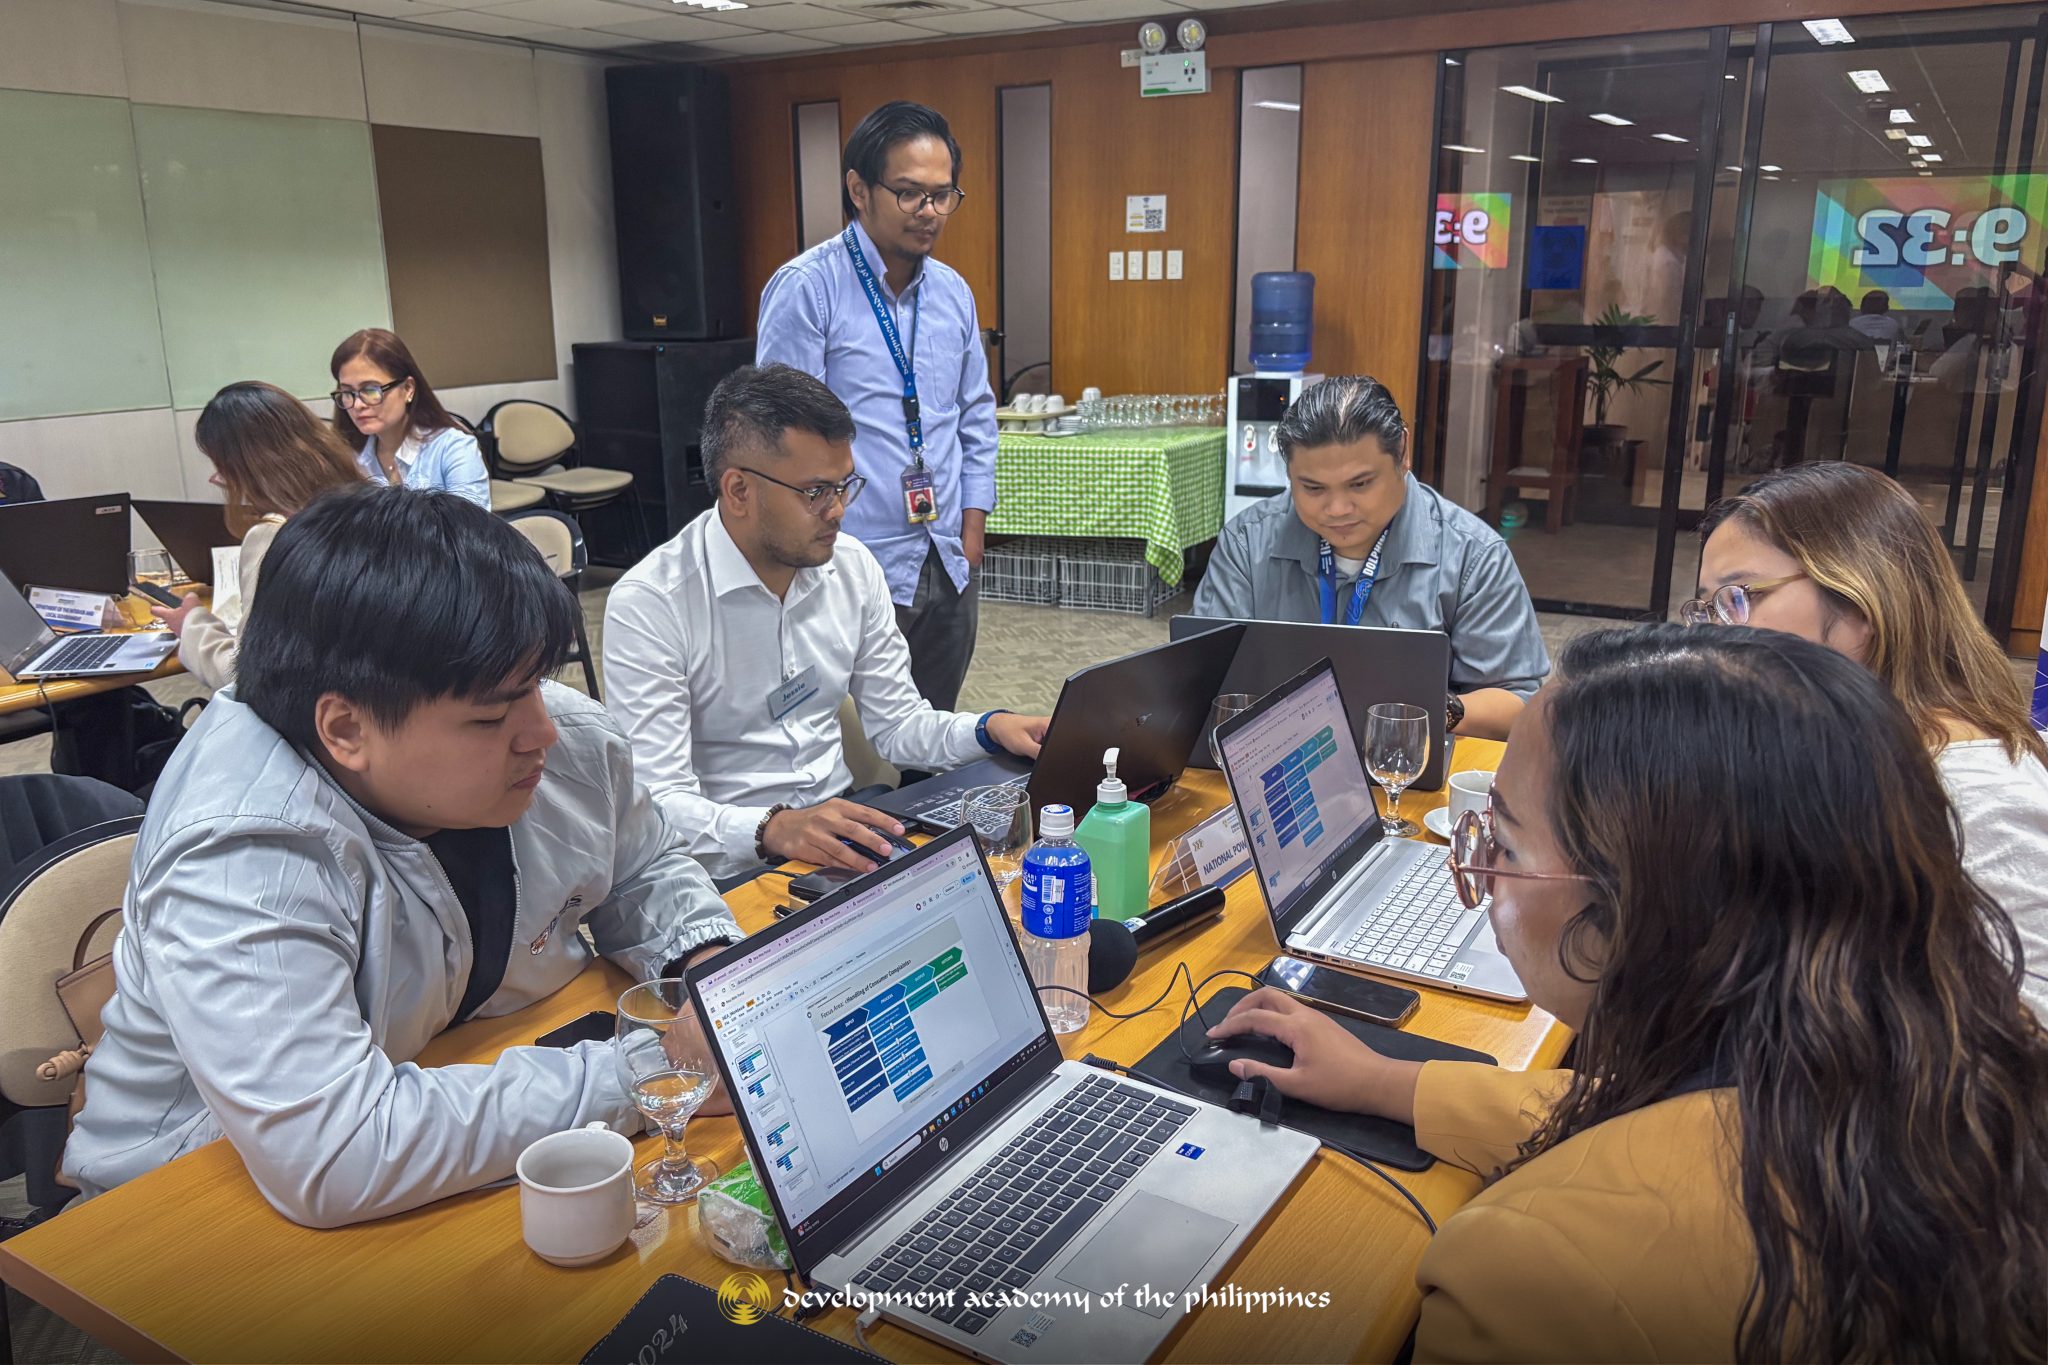
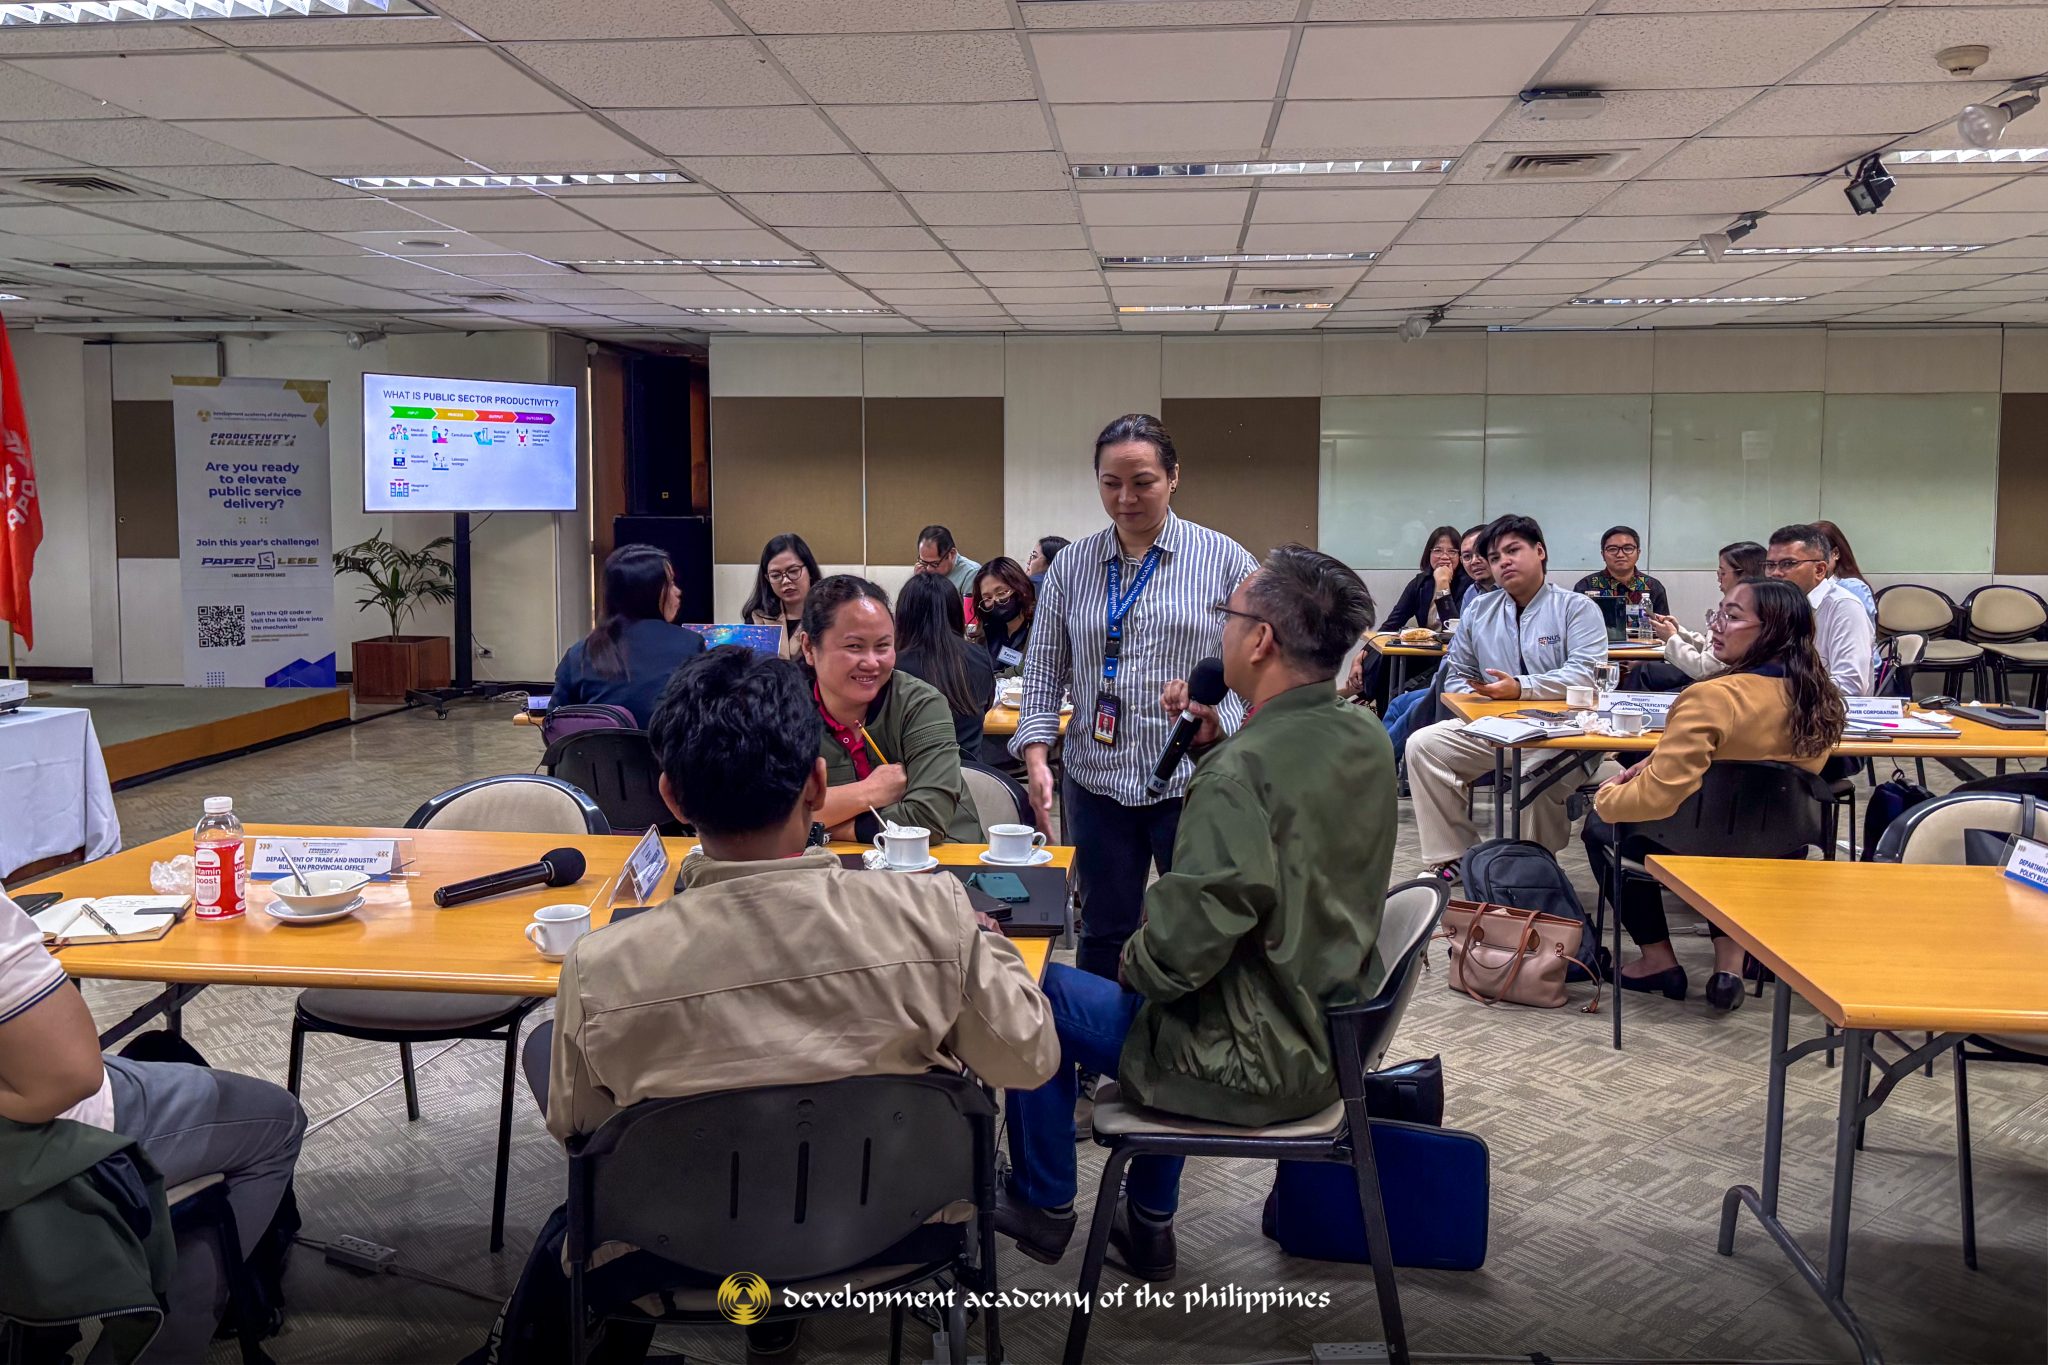
Held on 29 April 2025 at the DAP Building in Pasig City, Batch 3 brought together 26 participants from 12 government agencies, including Bicol University, Department of Agriculture, Department of Environment and Natural Resources – Ecosystems Research and Development Bureau, Department of the Interior and Local Government – Central Office and Isabela, Department of Trade and Industry – Bulaan Provincial Office, Lung Center of the Philippines, National Commission on Indigenous Peoples, National Dairy Authority, National Electrification Administration, National Power Corporation, and the Philippine Institute of Traditional and Alternative Health Care.
The workshop aimed to equip public-sector professionals with practical methods for diagnosing productivity challenges and to introduce tools that support the design of innovative, tailored solutions.
Learn more about the Productivity Challenge and explore its dynamic campaigns:
This article is originally posted on: https://dap.edu.ph/dap-advances-public-sector-innovation-with-third-batch-of-2025-productivity-challenge-workshop/
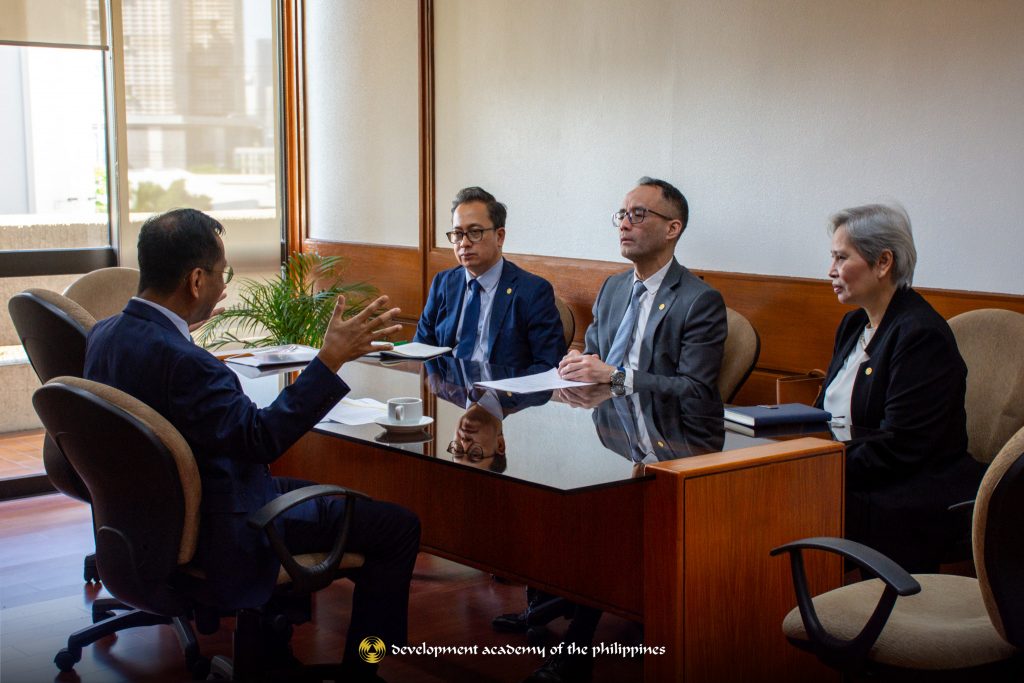
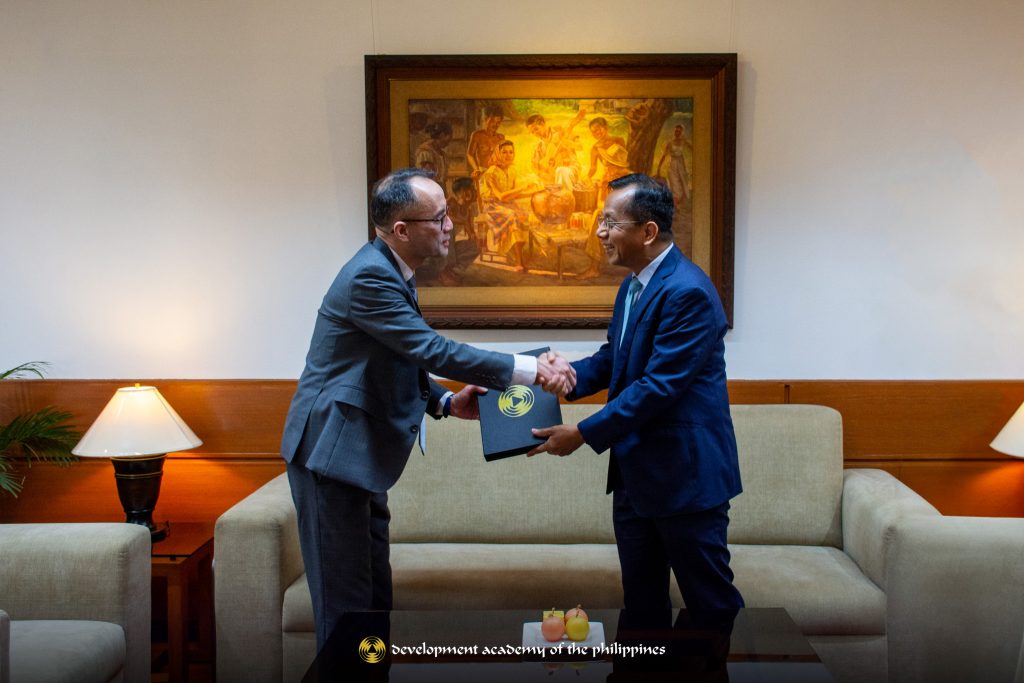
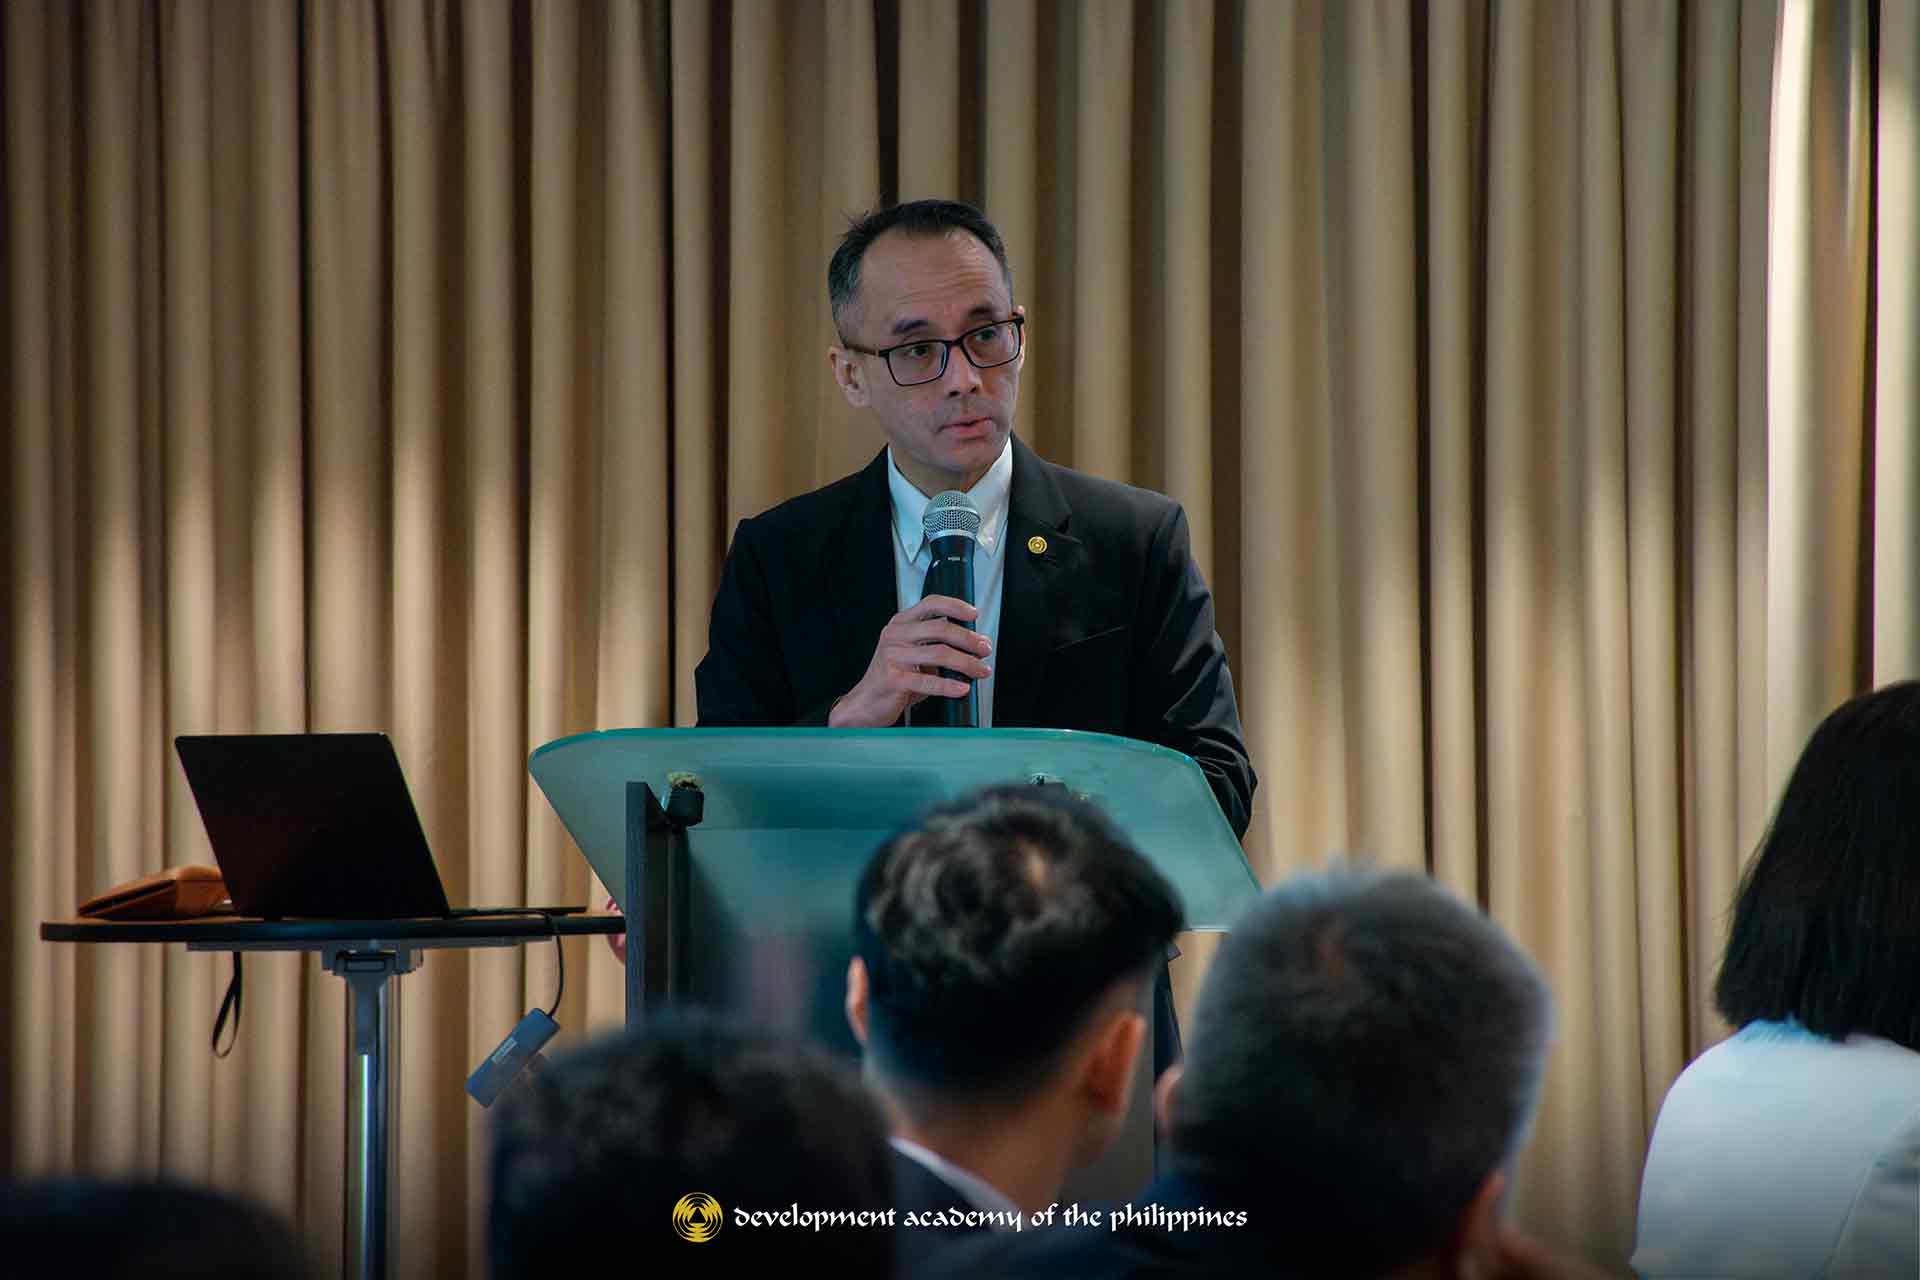
On April 10, 2025, Asian Productivity Organization (APO) Secretary-General, Dr. Indra Pradana Singawinata, paid a courtesy visit to DAP Board of Trustees Chair and National Economic and Development Authority Secretary Arsenio M. Balisacan at the Development Academy of the Philippines (DAP) Building in Pasig City.
Dr. Singawinata was accompanied by DAP Officer-in-Charge Magdalena L. Mendoza, APO Liaison Officer for the Philippines Armand Tristan Suratos, and APO Head for In-Country Programs Division Arsyoni Buana. The visit highlighted the strengthening of APO-DAP collaboration in addressing current challenges and advancing productivity as a pathway to sustainable and inclusive socioeconomic development across Asia and the Pacific.
The courtesy visit also coincided with the DAP site visit and activities for the Centers of Excellence (COE) Forum: Strengthening Platforms for Enhancing Productivity, which runs from April 9 to 11, 2025. The COE Forum serves as a vital platform for exchanging best practices, addressing common challenges, and exploring opportunities for innovation and cooperation among Centers of Excellence.
Participants include COE heads and National Productivity Organization representatives from Taiwan, Japan, India, Pakistan, and Vietnam.
This article is originally posted on: https://dap.edu.ph/apo-secretary-general-pays-courtesy-visit-to-dap-bot-chairperson/
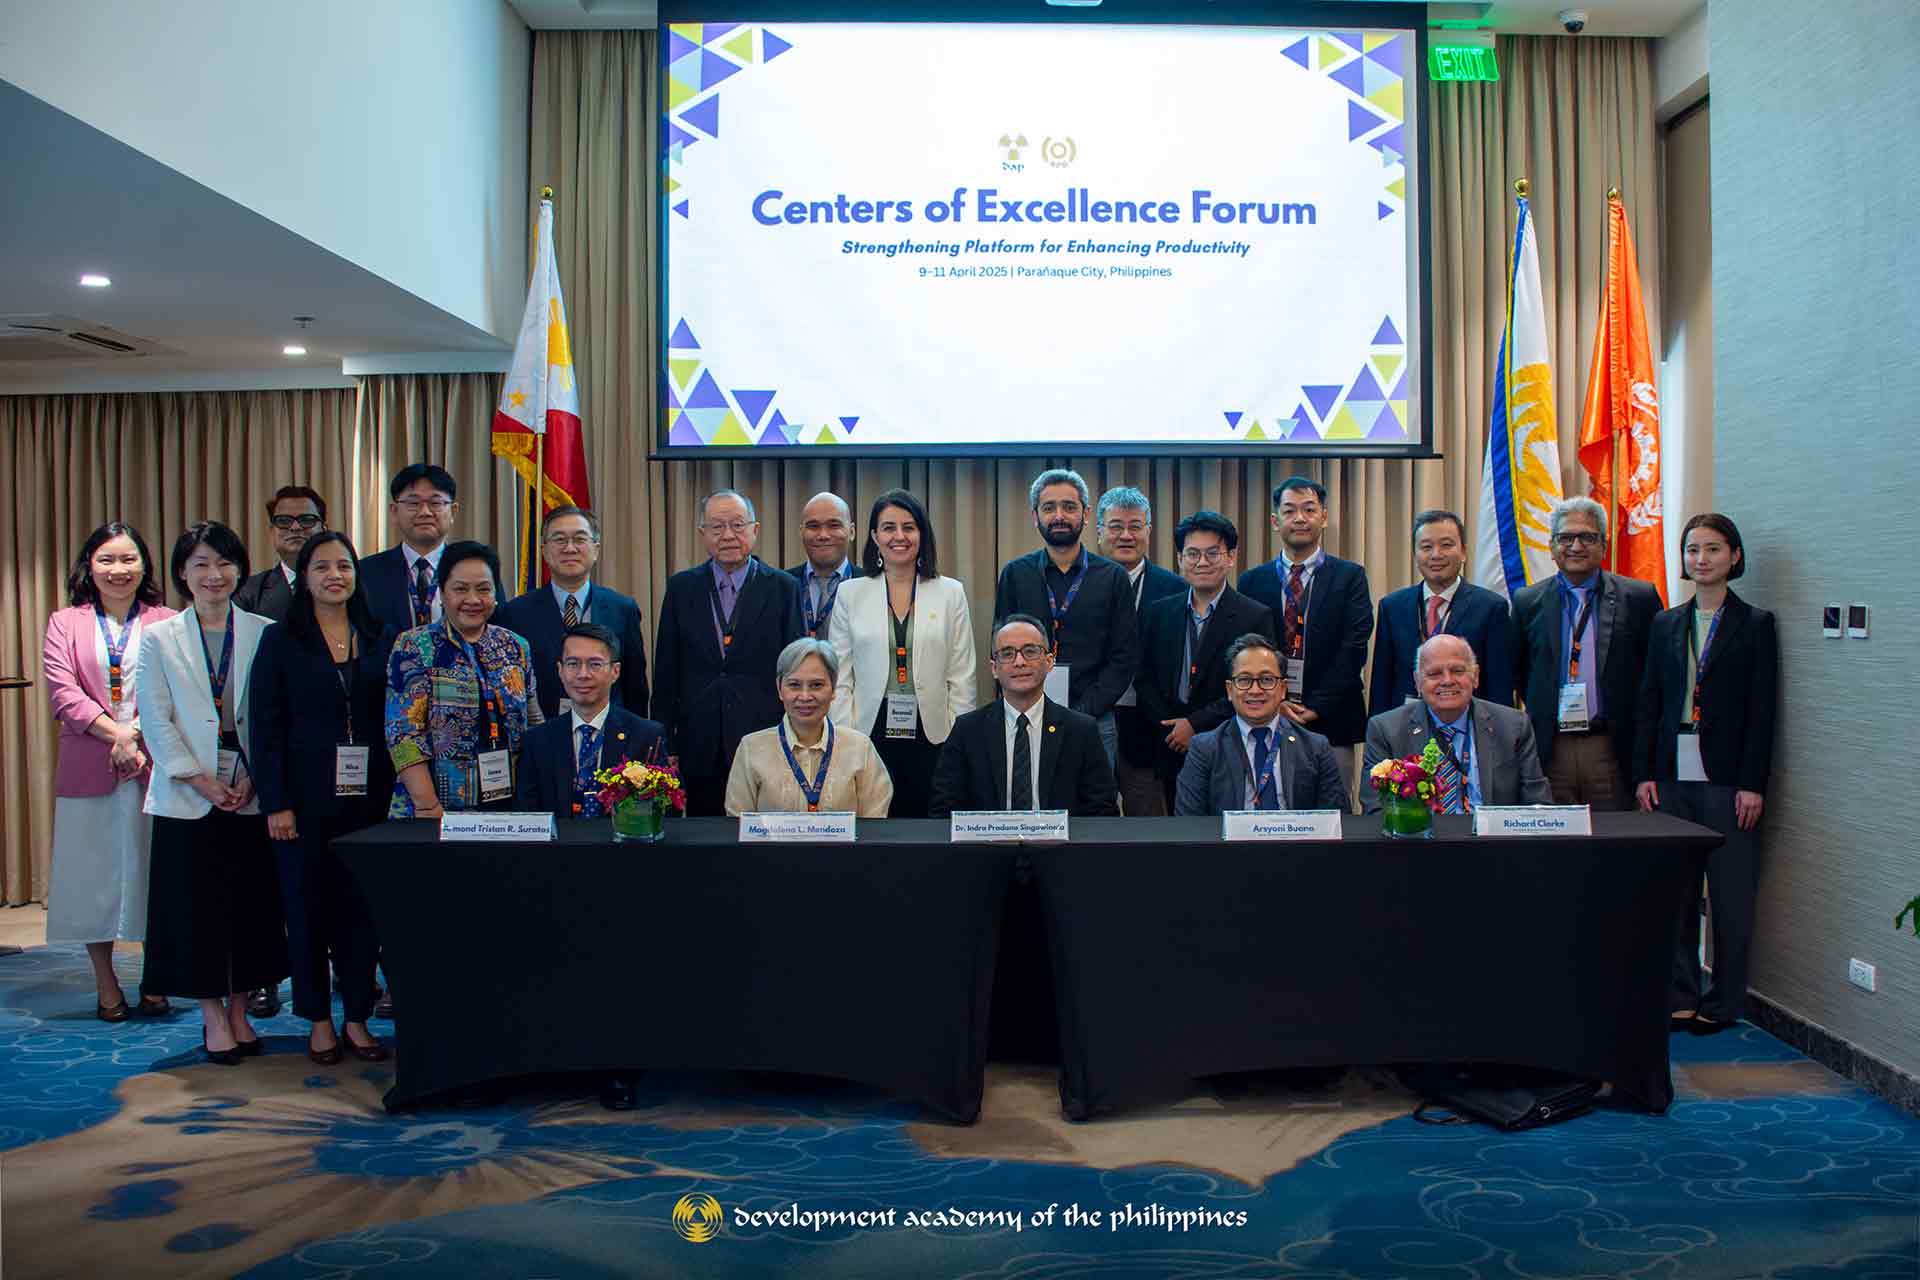
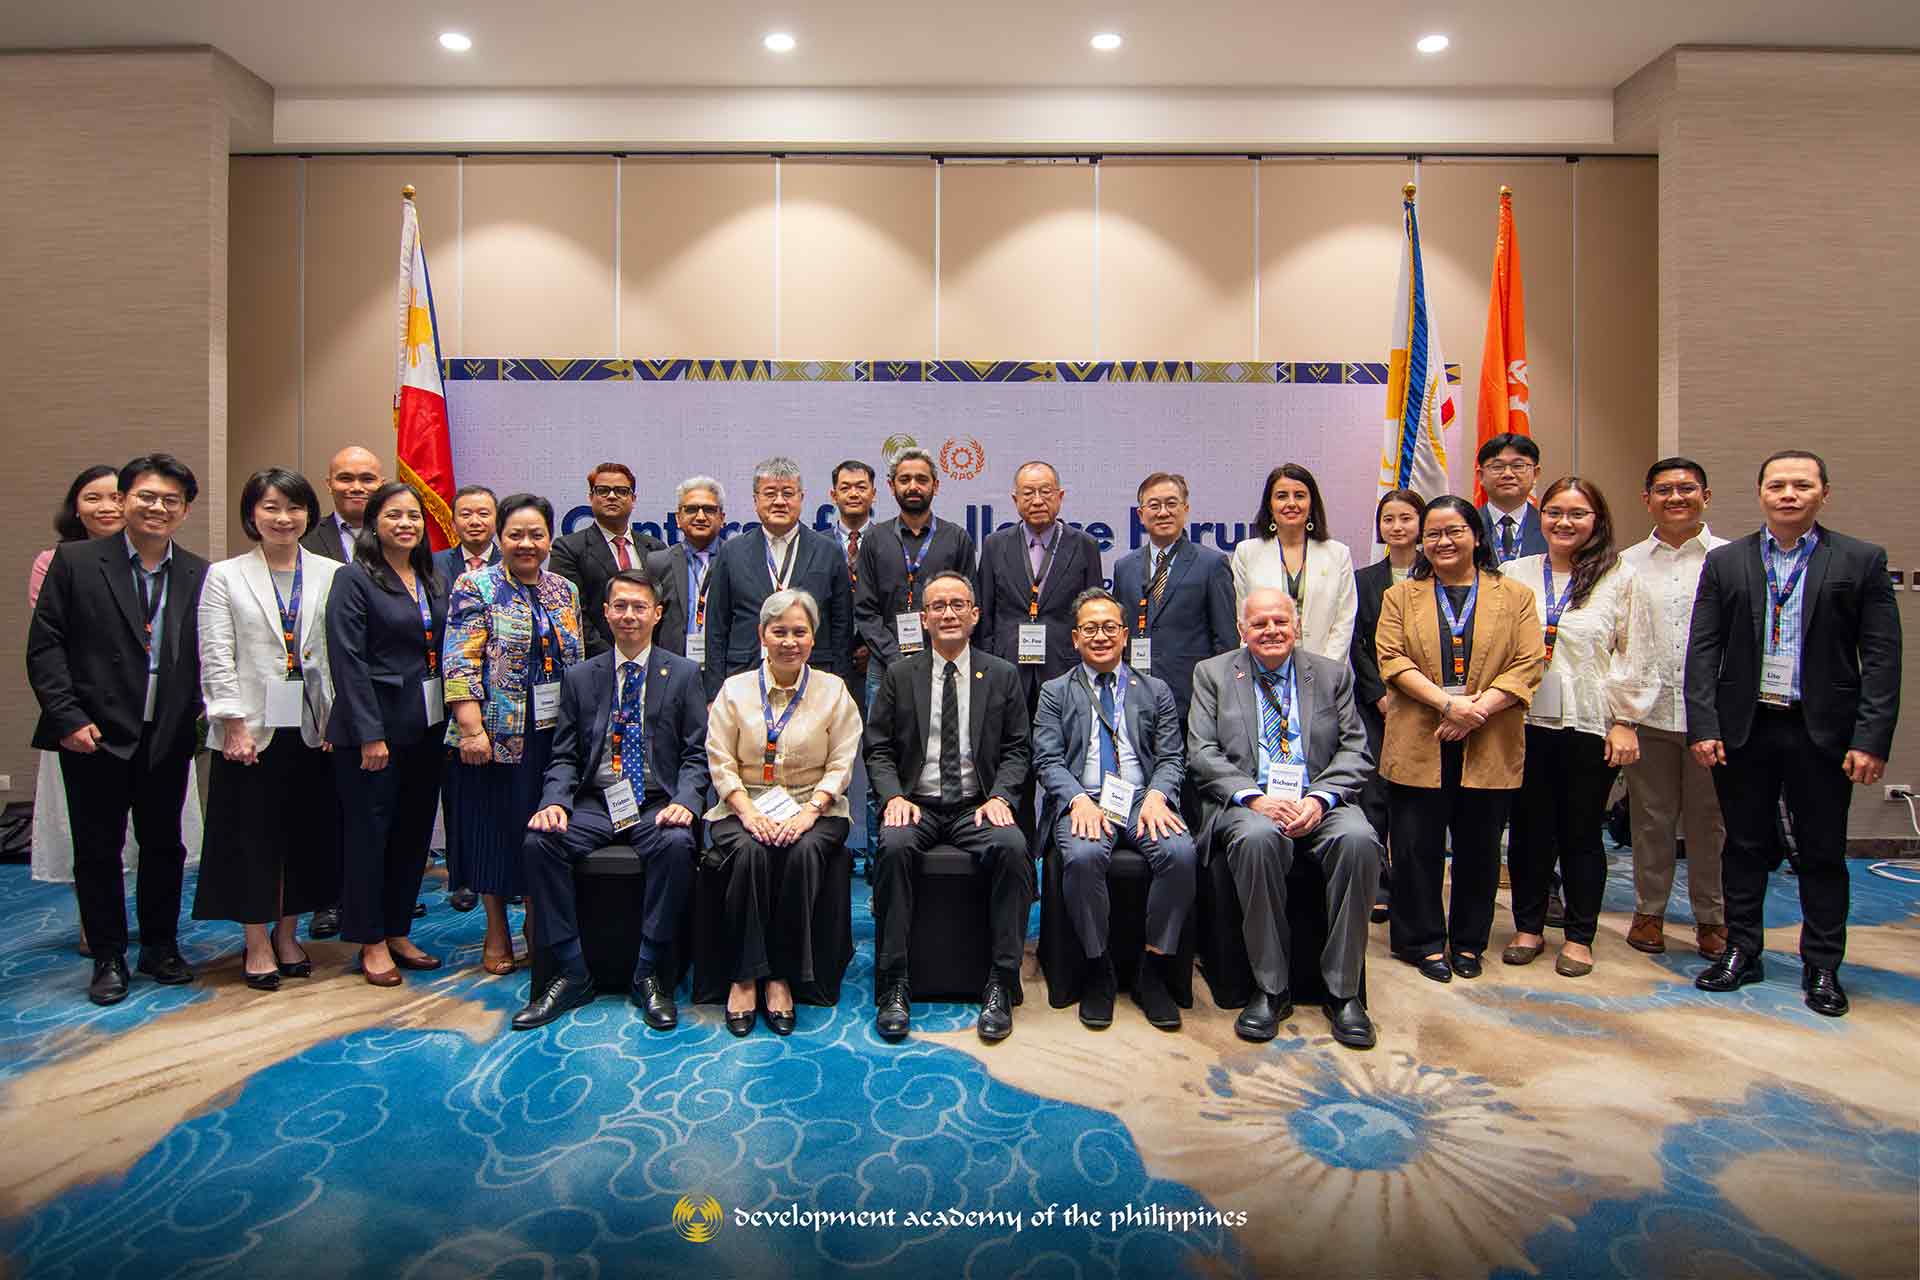
The Development Academy of the Philippines (DAP), in collaboration with the Asian Productivity Organization (APO), hosted the Centers of Excellence (COE) Forum from April 9 to 11, 2025, in Parañaque City. Centered on the theme “Strengthening Platforms for Enhancing Productivity,” the three-day forum brought together COE leaders, policymakers, and international experts to exchange insights, share best practices, and showcase innovations in excellence management to advance productivity across the region.
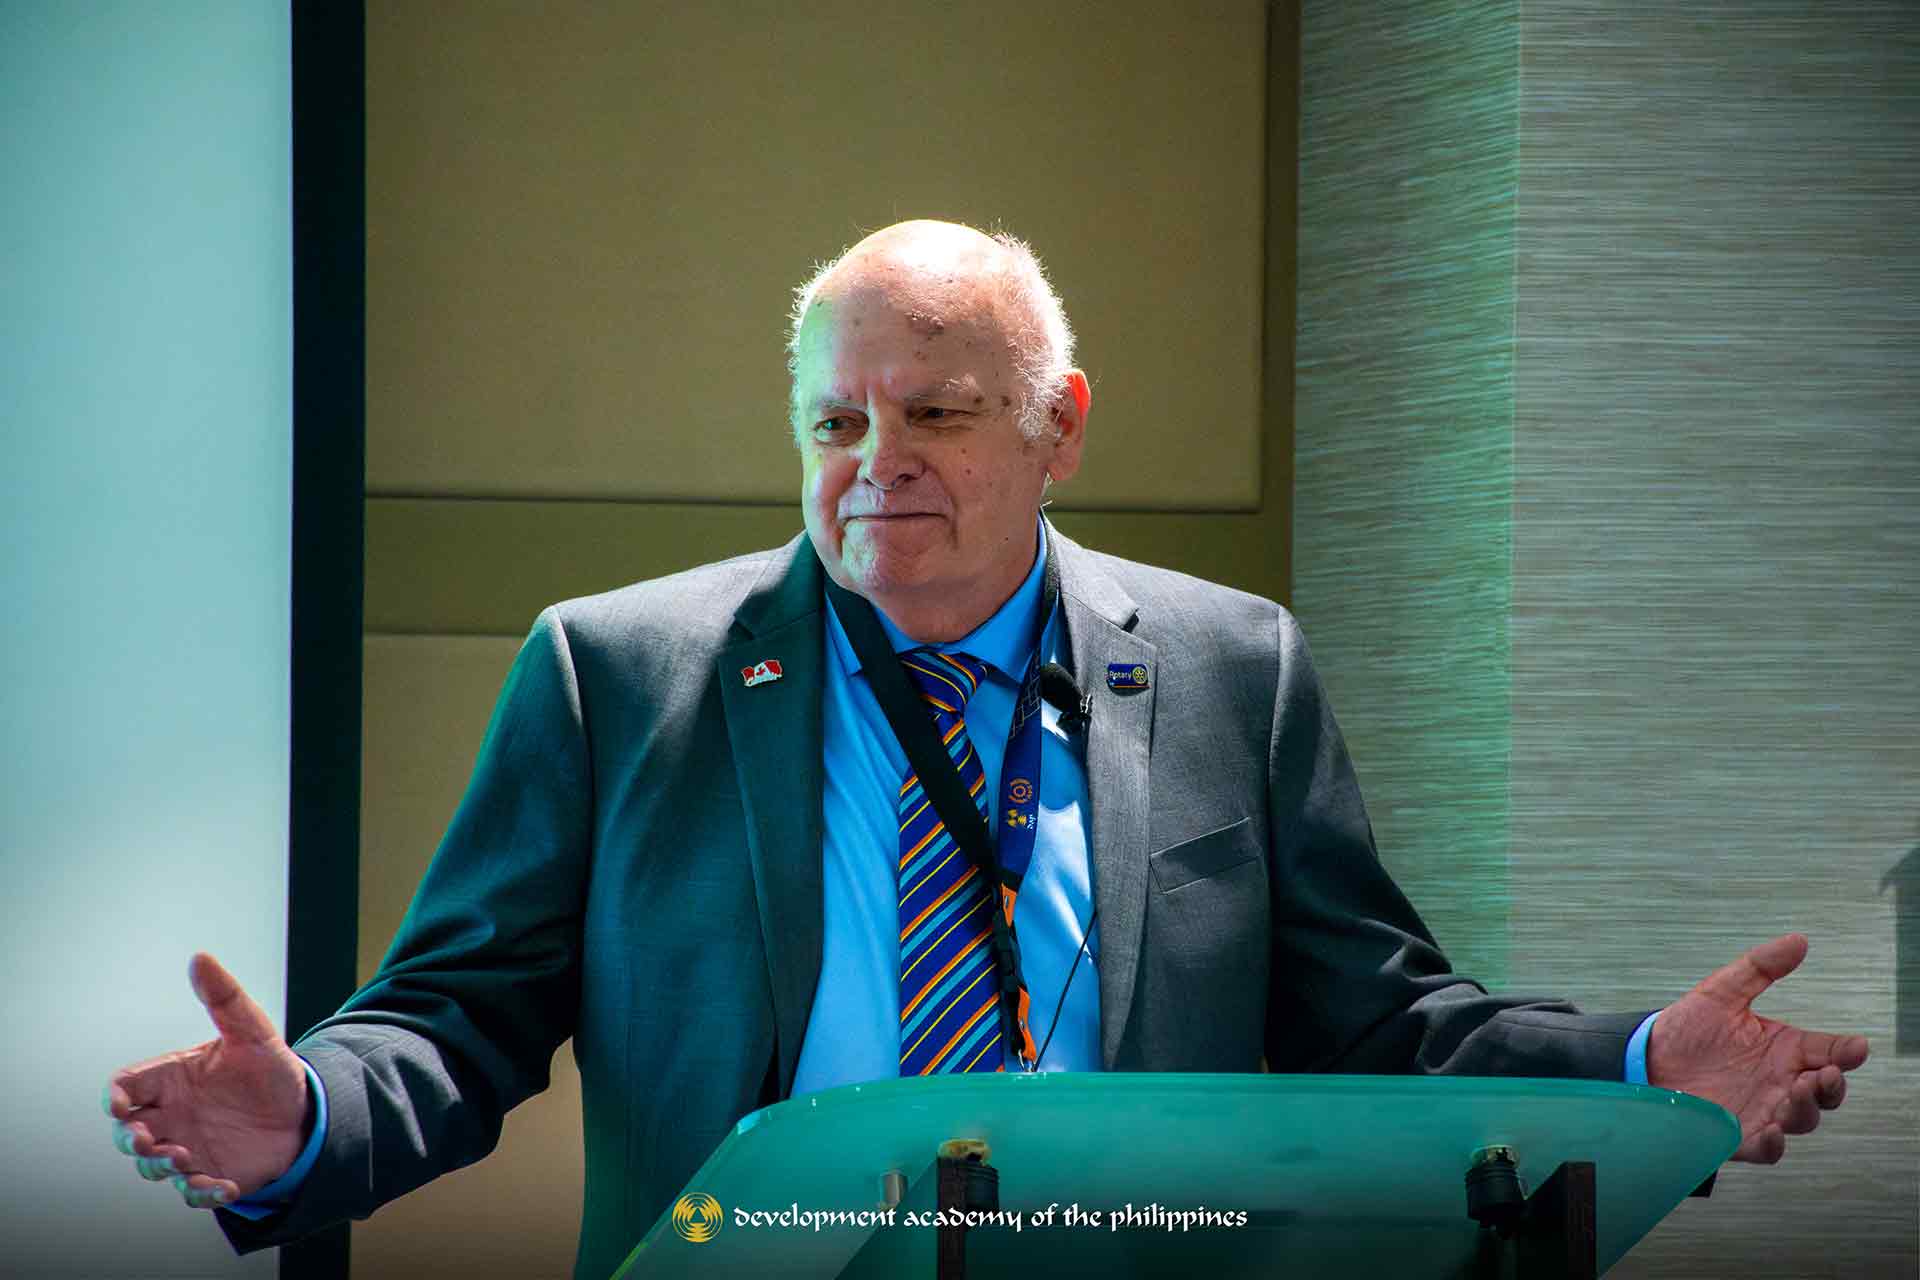
National Economic and Development Authority (NEDA) Secretary and APO Director for the Philippines, Dr. Arsenio M. Balisacan, and APO Secretary-General Dr. Indra Pradana Singawinata delivered the opening remarks. Richard Clarke, President of Avenidor Consults in Canada, shared global productivity trends and performance strategies for COEs.
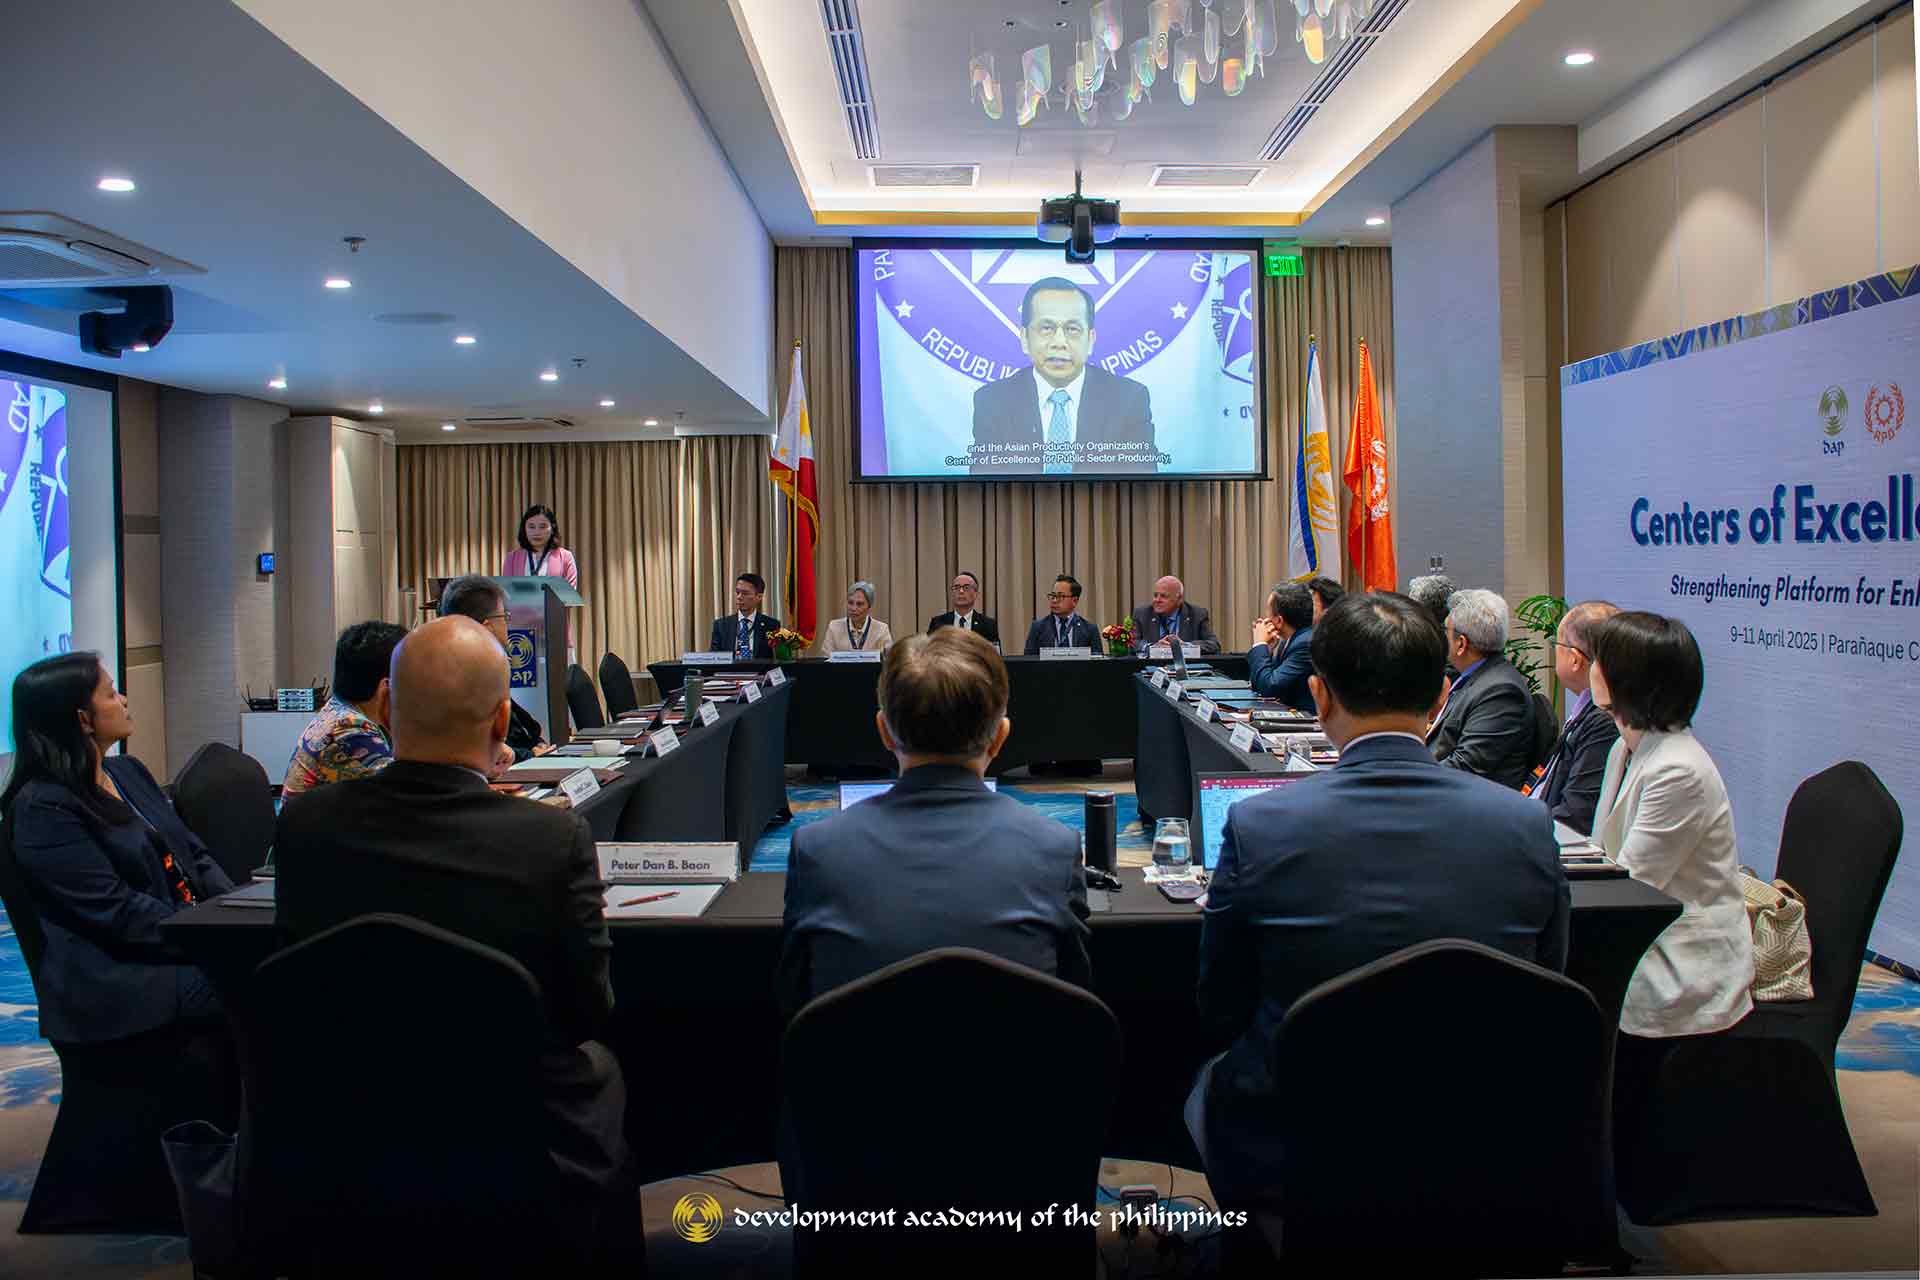
Key sessions included a presentation on global COE developments, a roundtable discussion among COE heads, and site visits to the DAP as COE on Public-Sector Productivity and the Government Service Insurance System (GSIS).
The forum aimed to promote cross-country collaboration, enhance performance assessment strategies, and shape the strategic direction of COEs across the region. Participating COEs included:
COE on IT for Industry 4.0 – National Productivity Council, India
COE on Green Productivity – China Productivity Center, Republic of China
COE on Smart Manufacturing – China Productivity Center, Republic of China
COE on Climate-Smart Agriculture – National Agriculture and Food Research Organization, Japan
COE on Public-Sector Productivity – Development Academy of the Philippines
Japan Productivity Center
Virtual University of Pakistan
National Productivity Organization, Pakistan
Commission for Standards, Metrology, and Quality of Vietnam (STAMEQ)
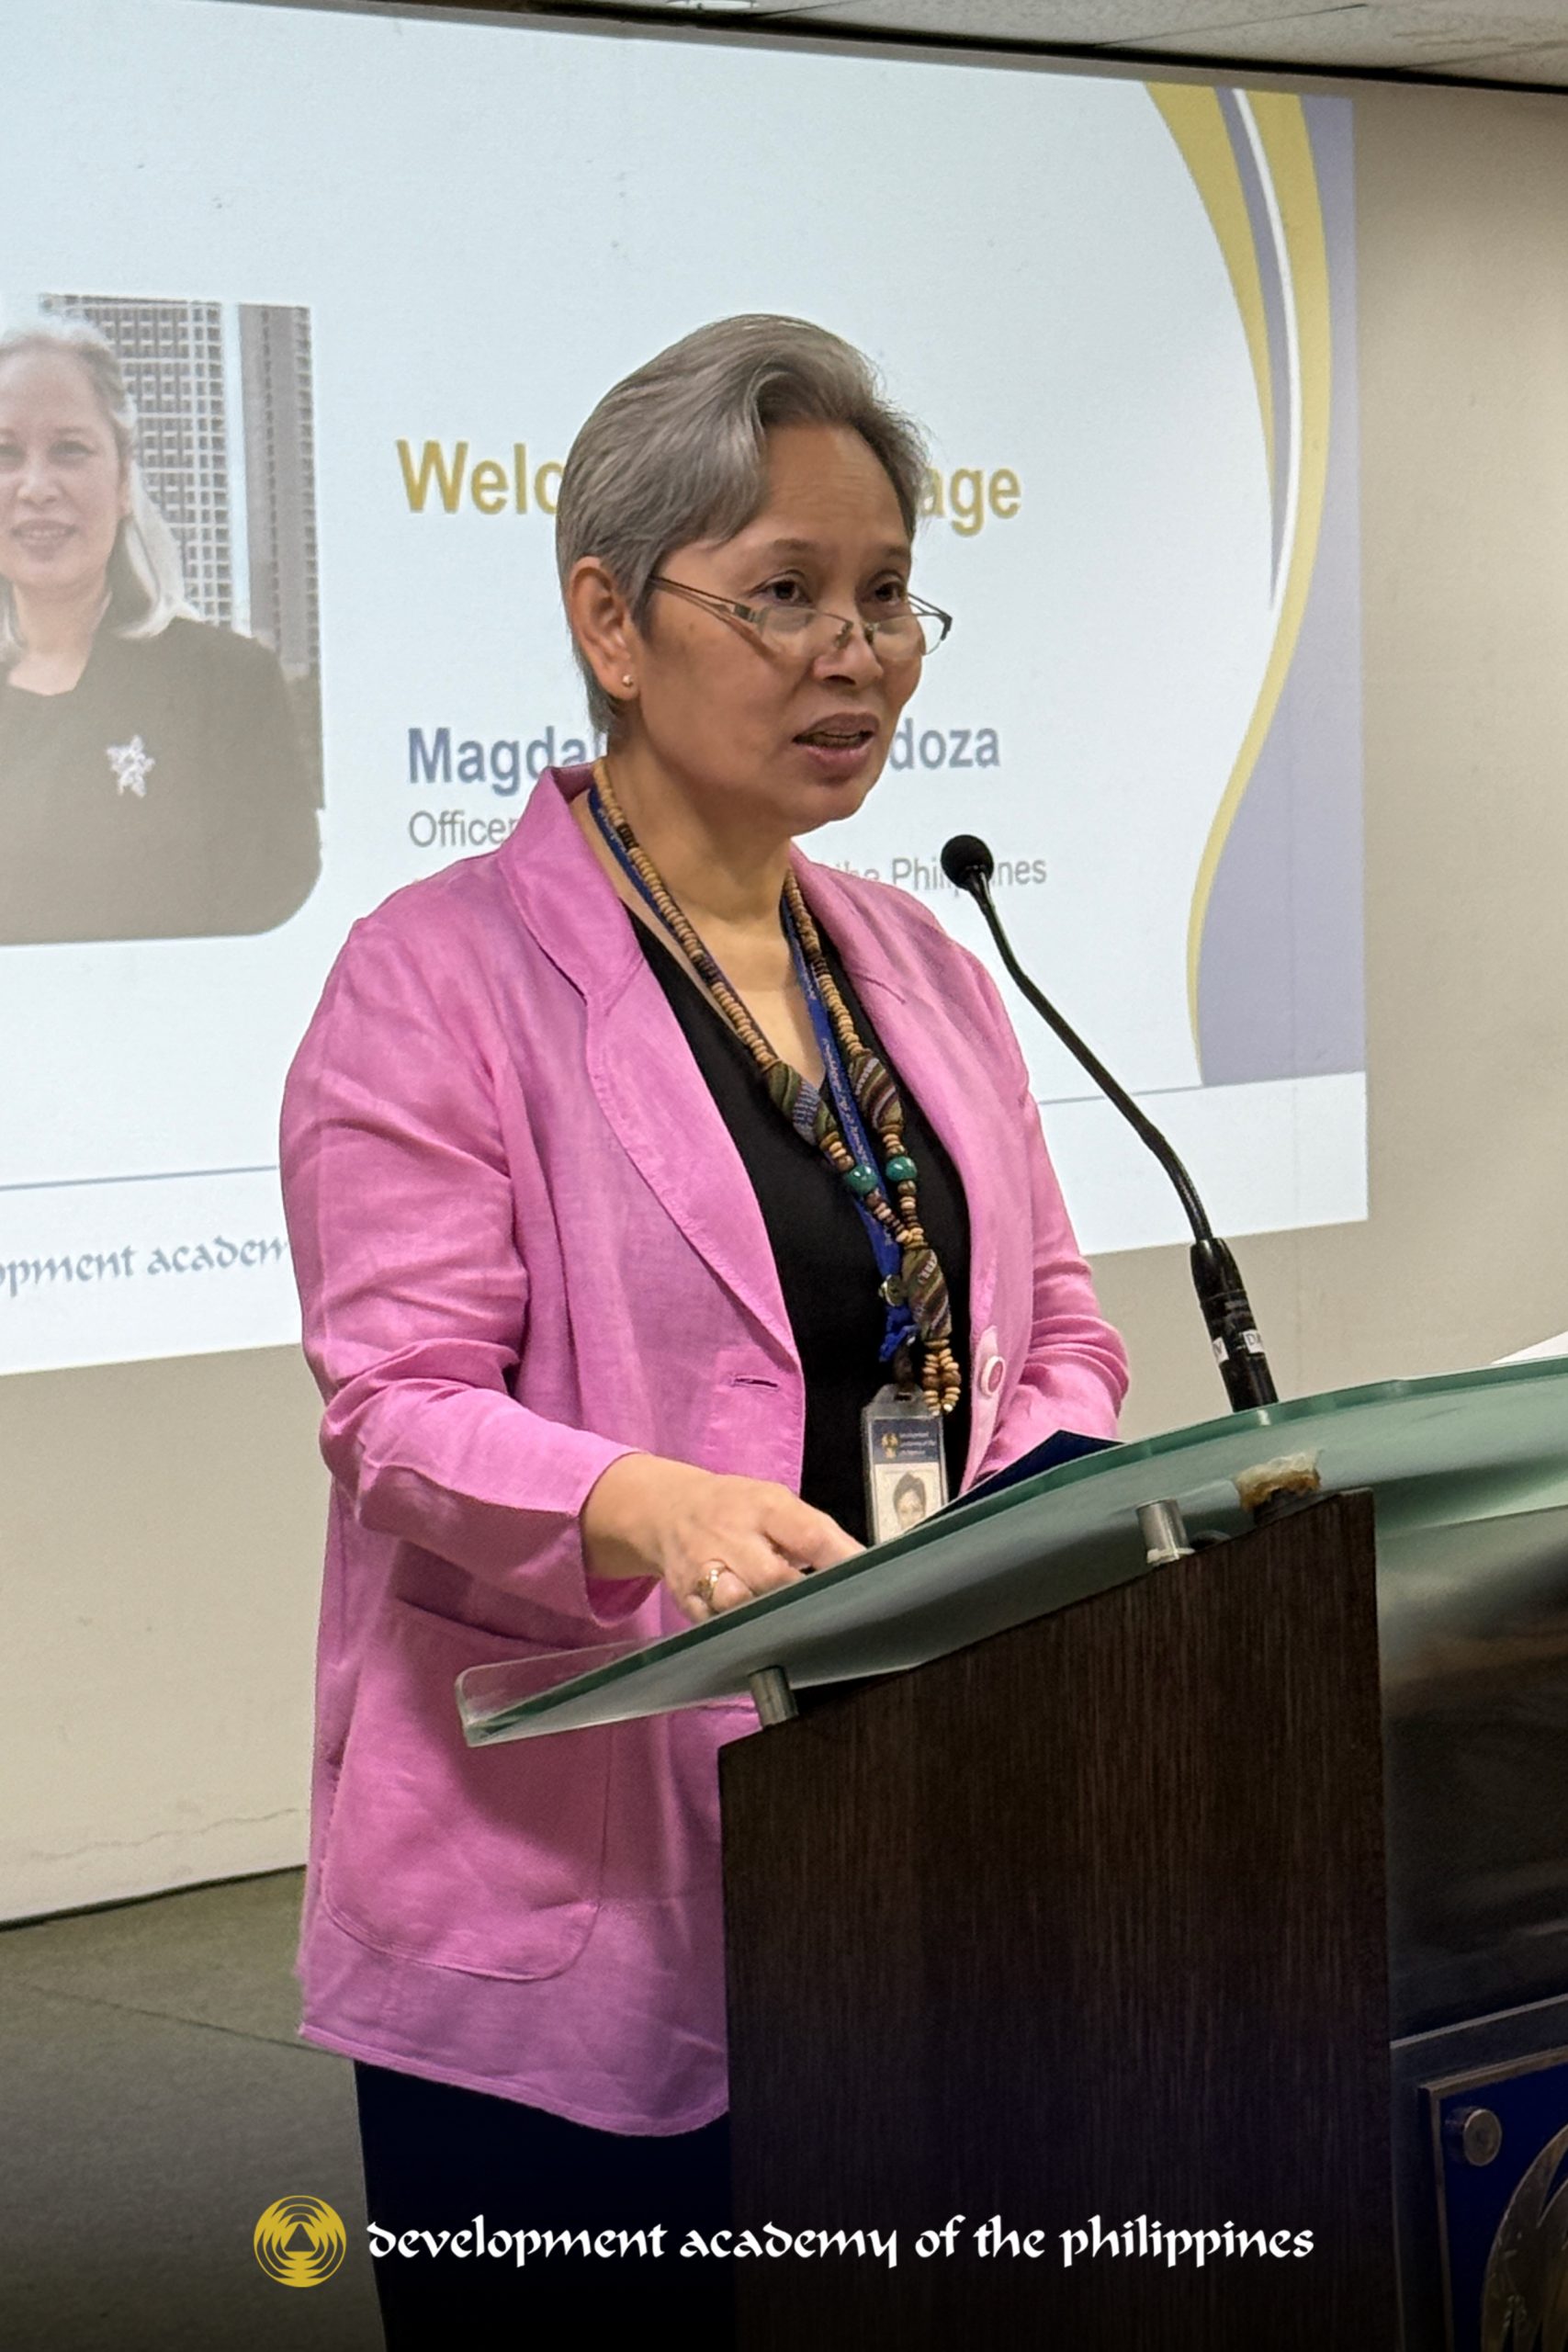
In her closing remarks, DAP Officer-in-Charge and Senior Vice President for Programs Magdalena L. Mendoza emphasized the importance of collaboration, knowledge-sharing, and sustaining excellence as a shared responsibility among Centers of Excellence. She thanked APO, partners, and organizers for contributing to the forum’s success. She highlighted the Philippines’ commitment to advancing productivity and prosperity across the Asia-Pacific region. OIC Mendoza concluded by encouraging continued partnerships and affirmed that DAP will always be a home for future collaboration.
The event reaffirmed DAP’s strong commitment to fostering innovation and collaboration among Centers of Excellence, with the shared goal of improving productivity and strengthening performance assessment strategies in various sectors throughout Asia.
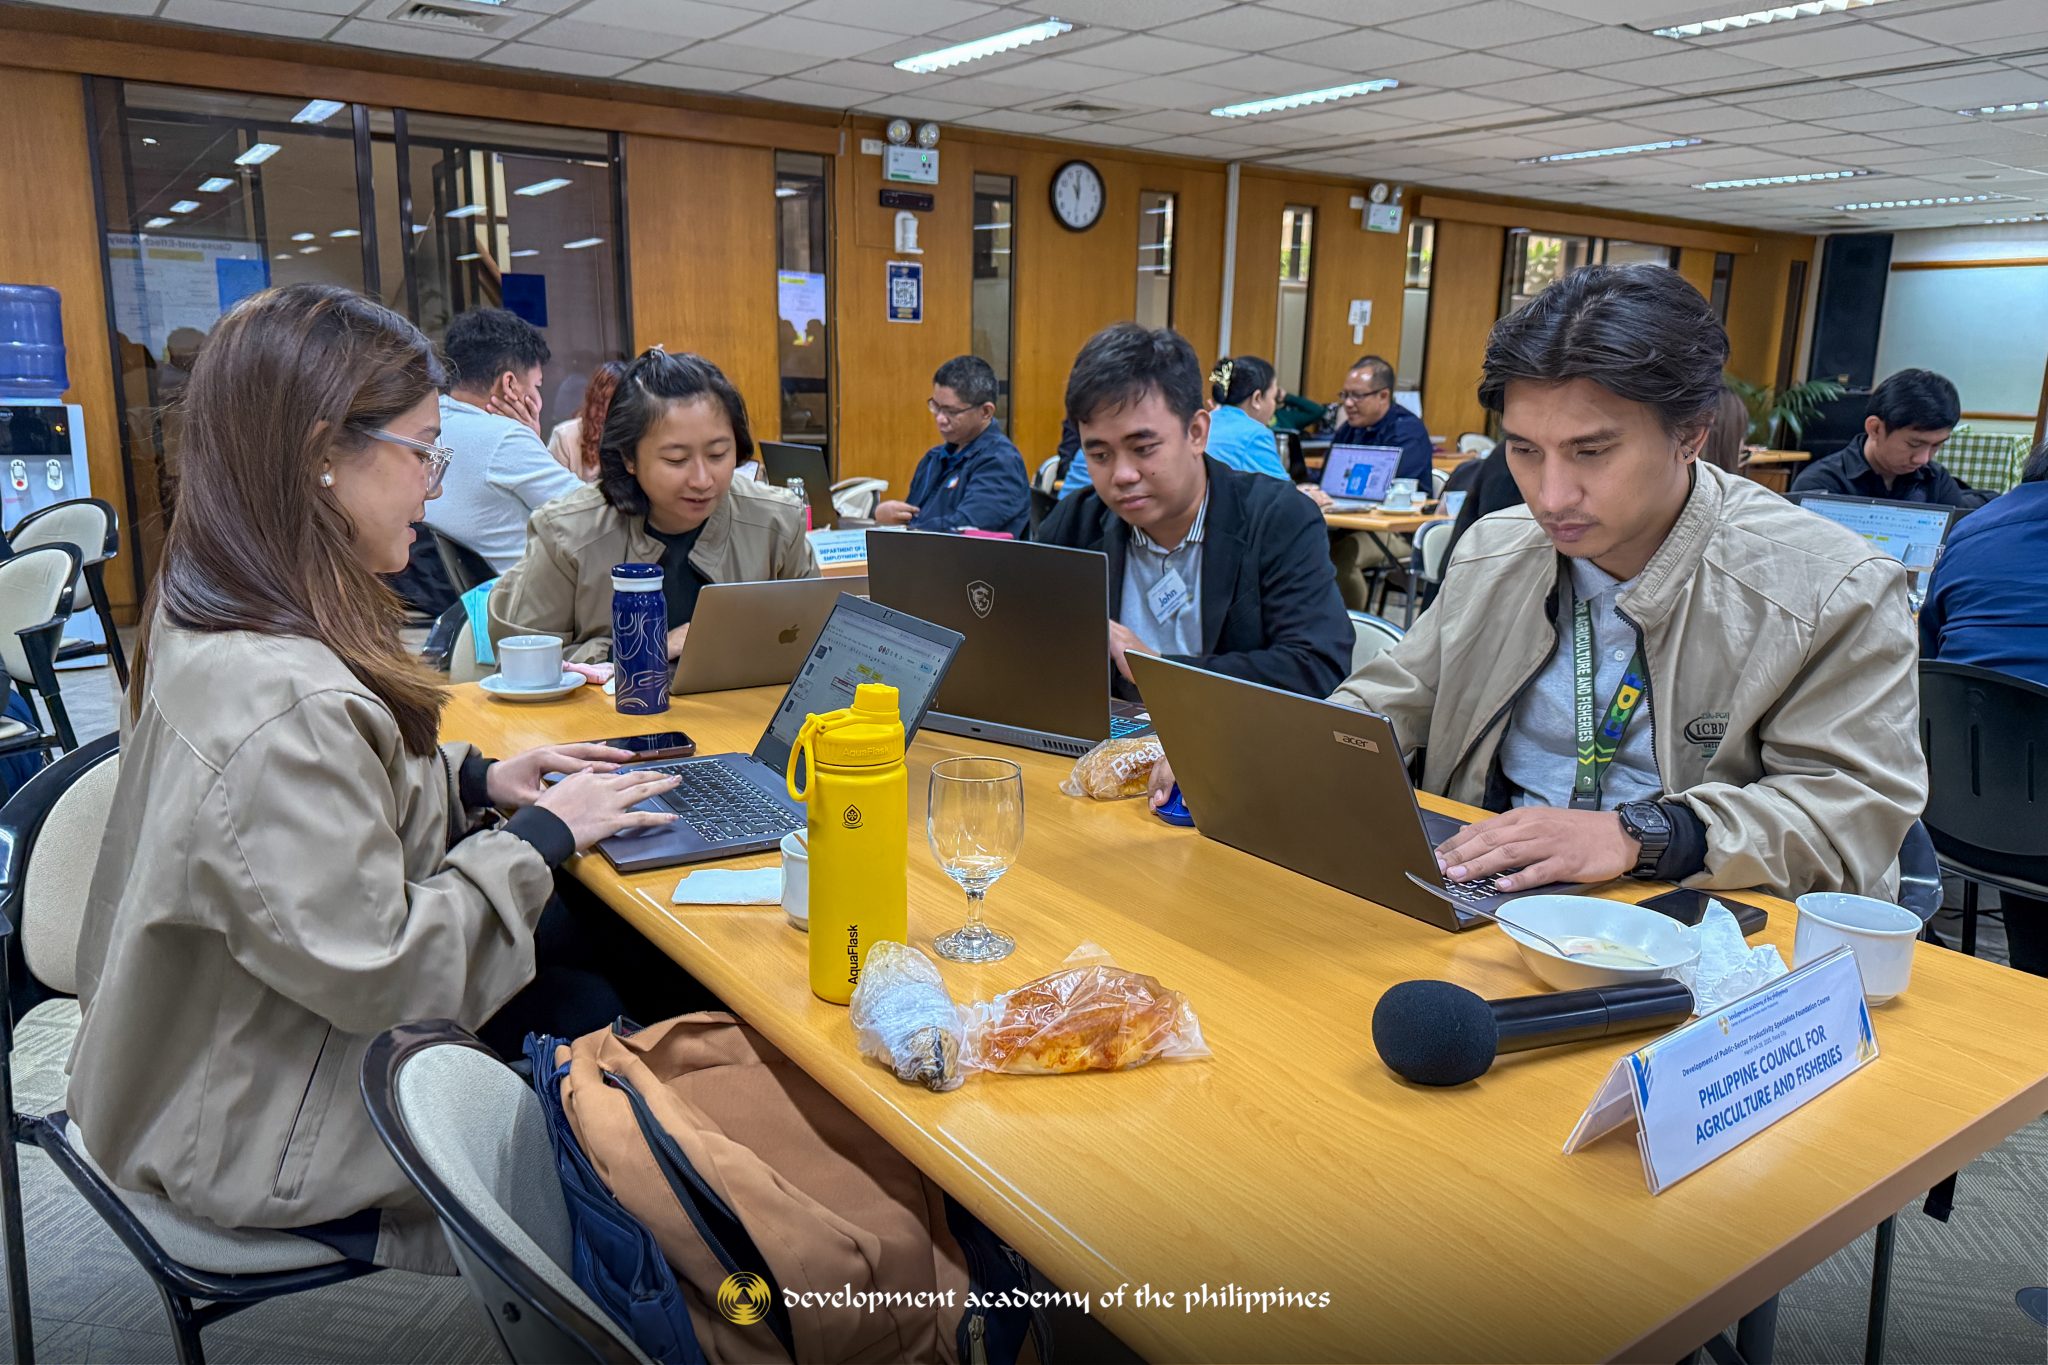
The Development Academy of the Philippines (DAP), as the focal organization of the Asian Productivity Organization (APO) Center of Excellence on Public-Sector Productivity, successfully concluded the Upskilling Phase of the 2025 Development of Public-Sector Productivity Specialists Foundation Course (DPSPSFC) on March 28, 2025.
Held from March 24 to 28, the upskilling phase brought together public sector productivity champions from 11 national government agencies, attached agencies, state universities and colleges, and one local government unit. This intensive training is part of a multi-phase program that builds the capability of public sector professionals to design and implement productivity improvement initiatives in their respective institutions.
The DPSPS Foundation Course is one of DAP’s key interventions in support of the Philippine Development Plan 2023–2028, aiming to enhance public sector performance.
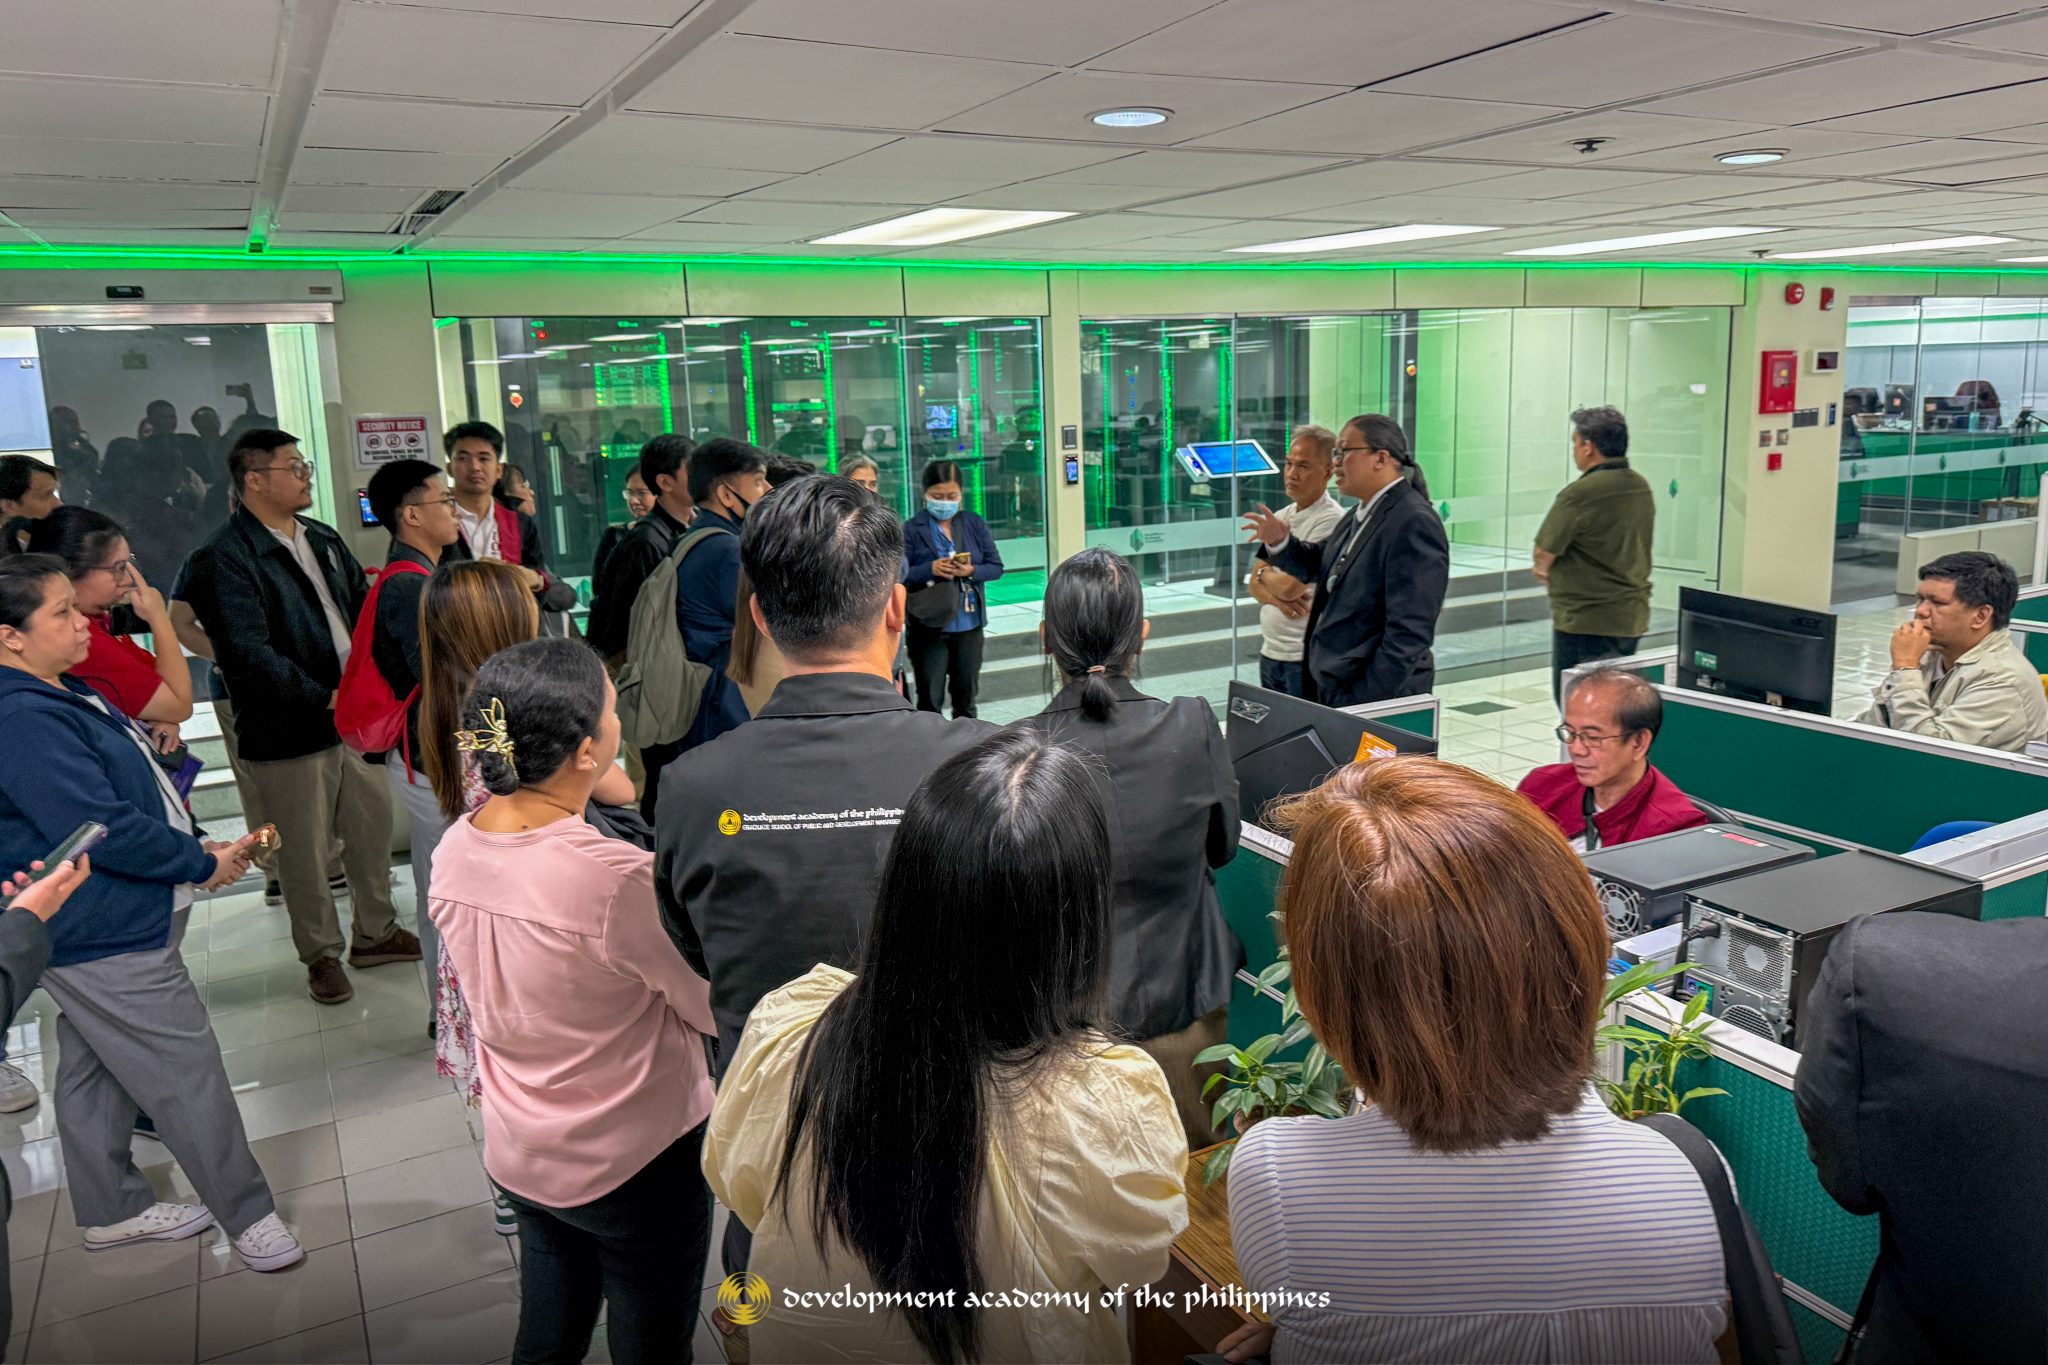
A highlight of the week was the site visit and case presentation at the Securities and Exchange Commission (SEC), where participants learned about the SEC’s productivity initiatives—including Digital-All: IT’s Grin and Green, the Unified Company Database, and Sustaina-All: EMIL. The visit provided concrete insights on how digitalization and sustainability are being integrated into public sector operations.
To cap off the training, participants presented their Productivity Improvement Plans (PIPs) before their peers and course coaches—receiving feedback and direction as they move into the next phase, where they will pitch and pilot their initiatives within their agencies.
As the course progresses, participants are expected to apply their learning to help build a more agile, responsive, and innovative public sector.
The article is originally posted on: https://dap.edu.ph/public-sector-productivity-champions-complete-upskilling-phase-of-2025-dpsps-foundation-course/
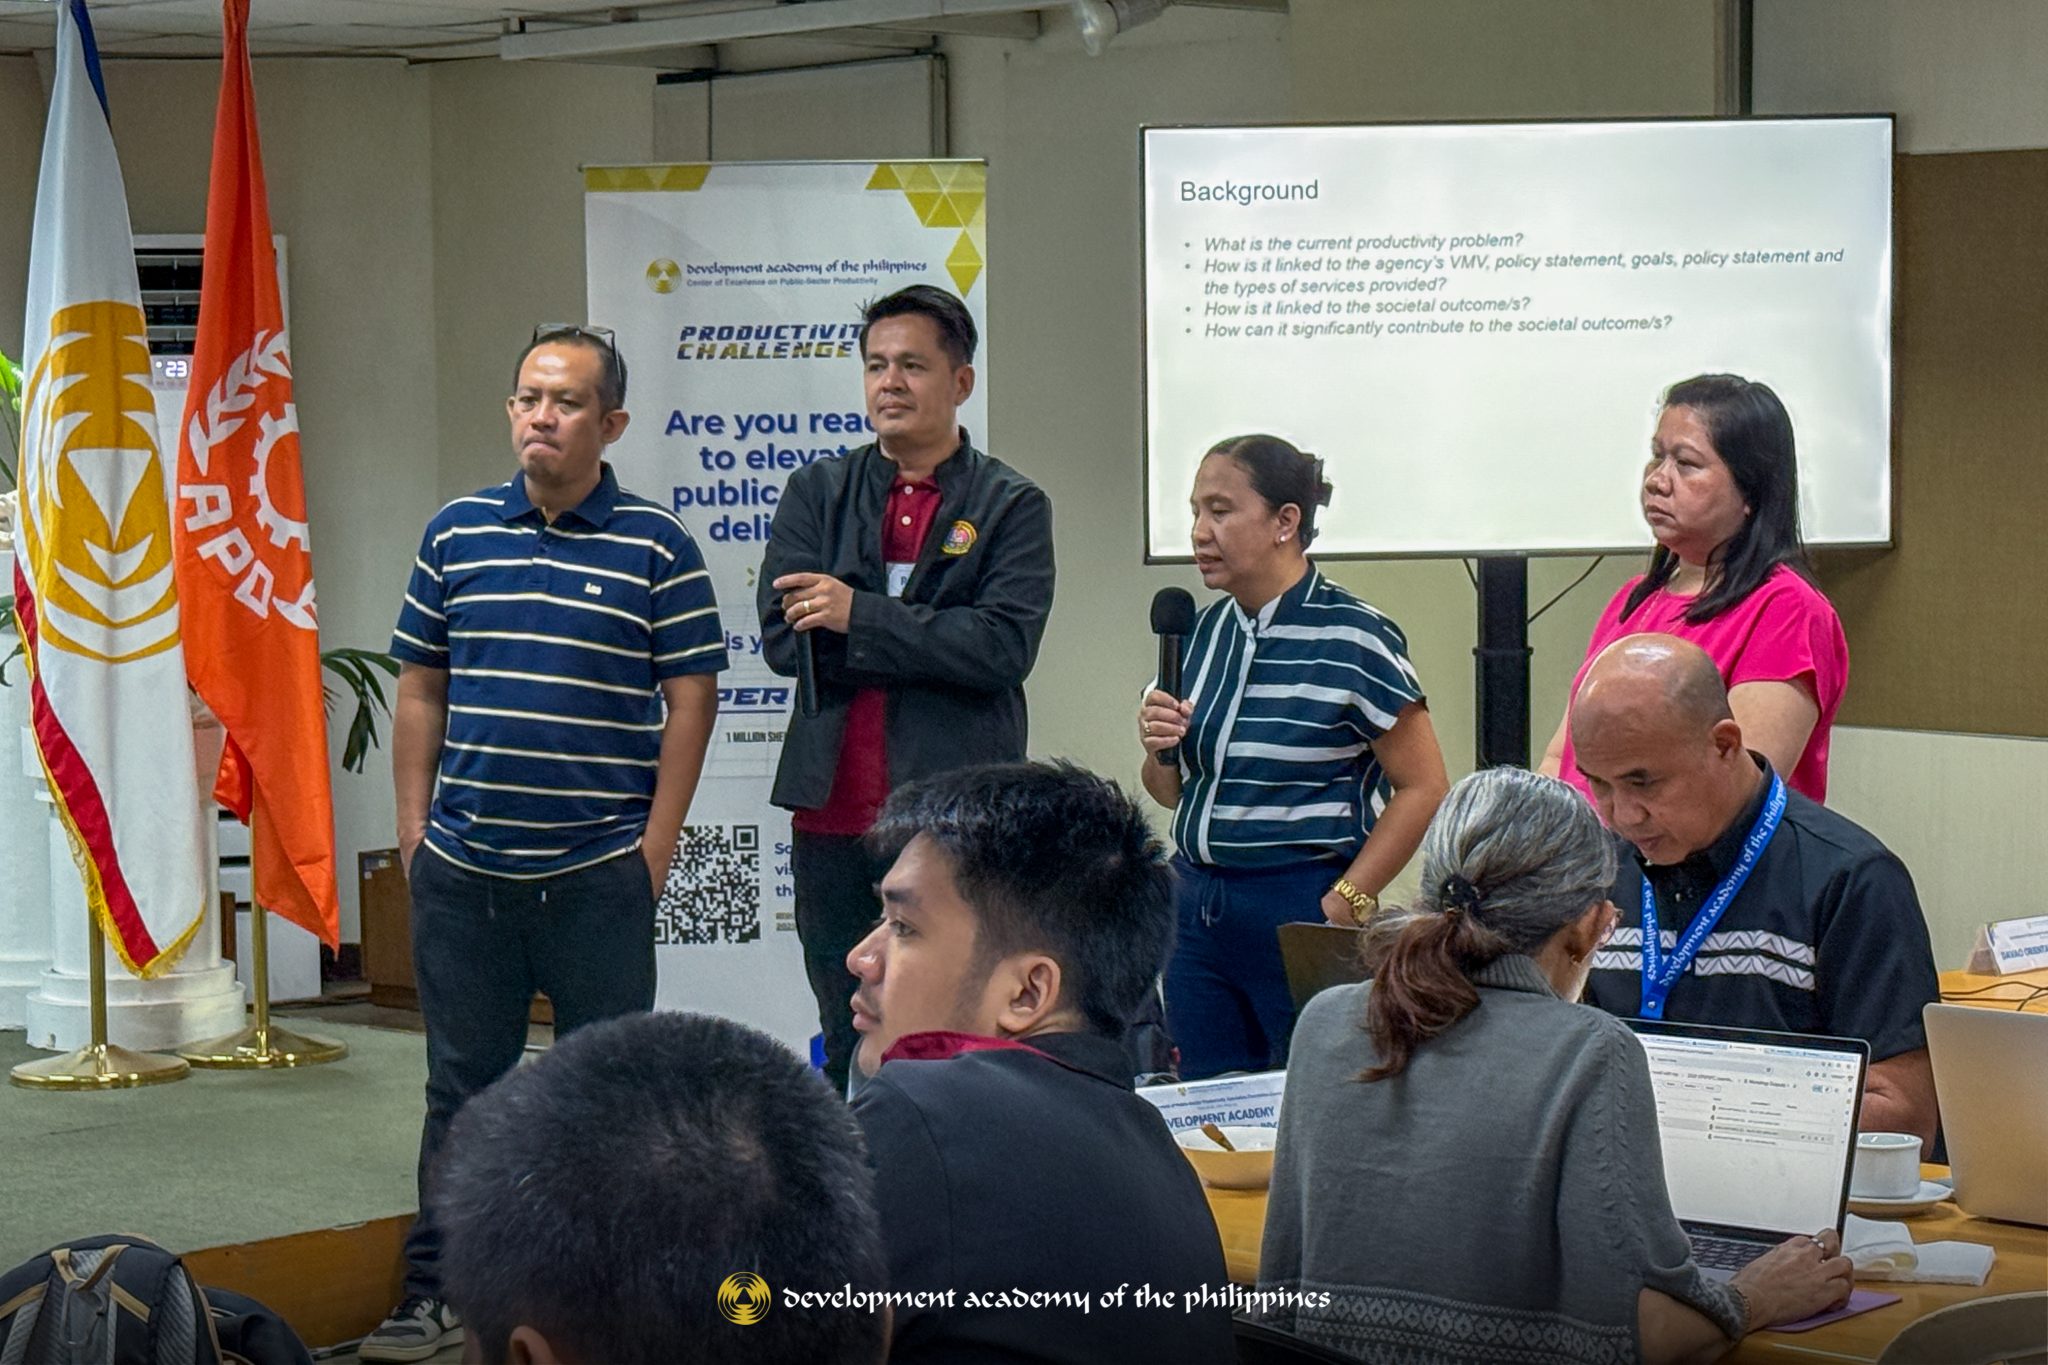
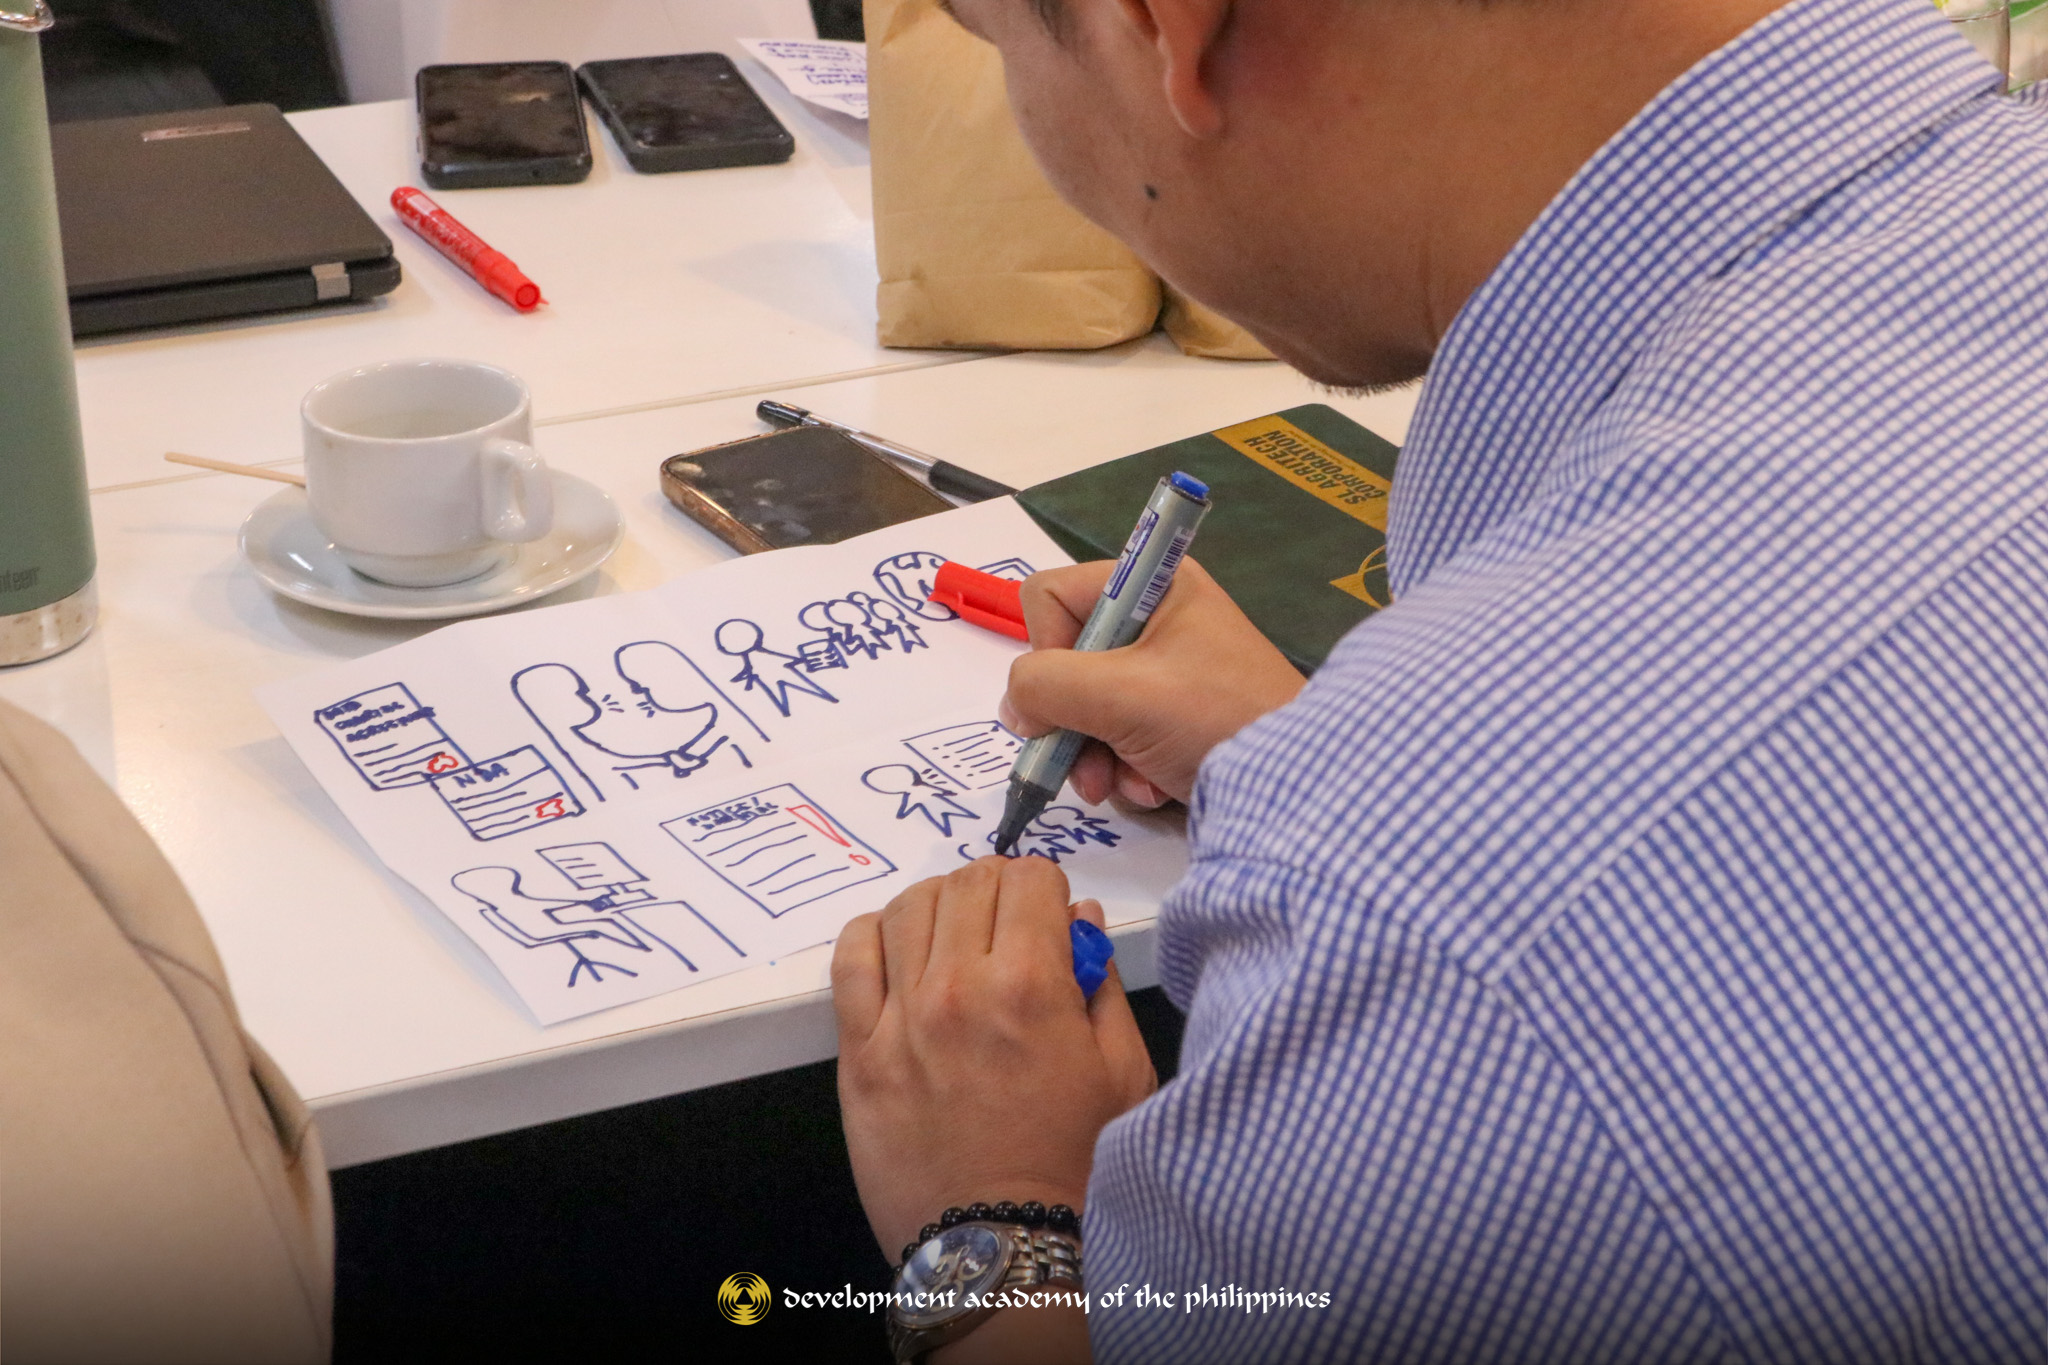
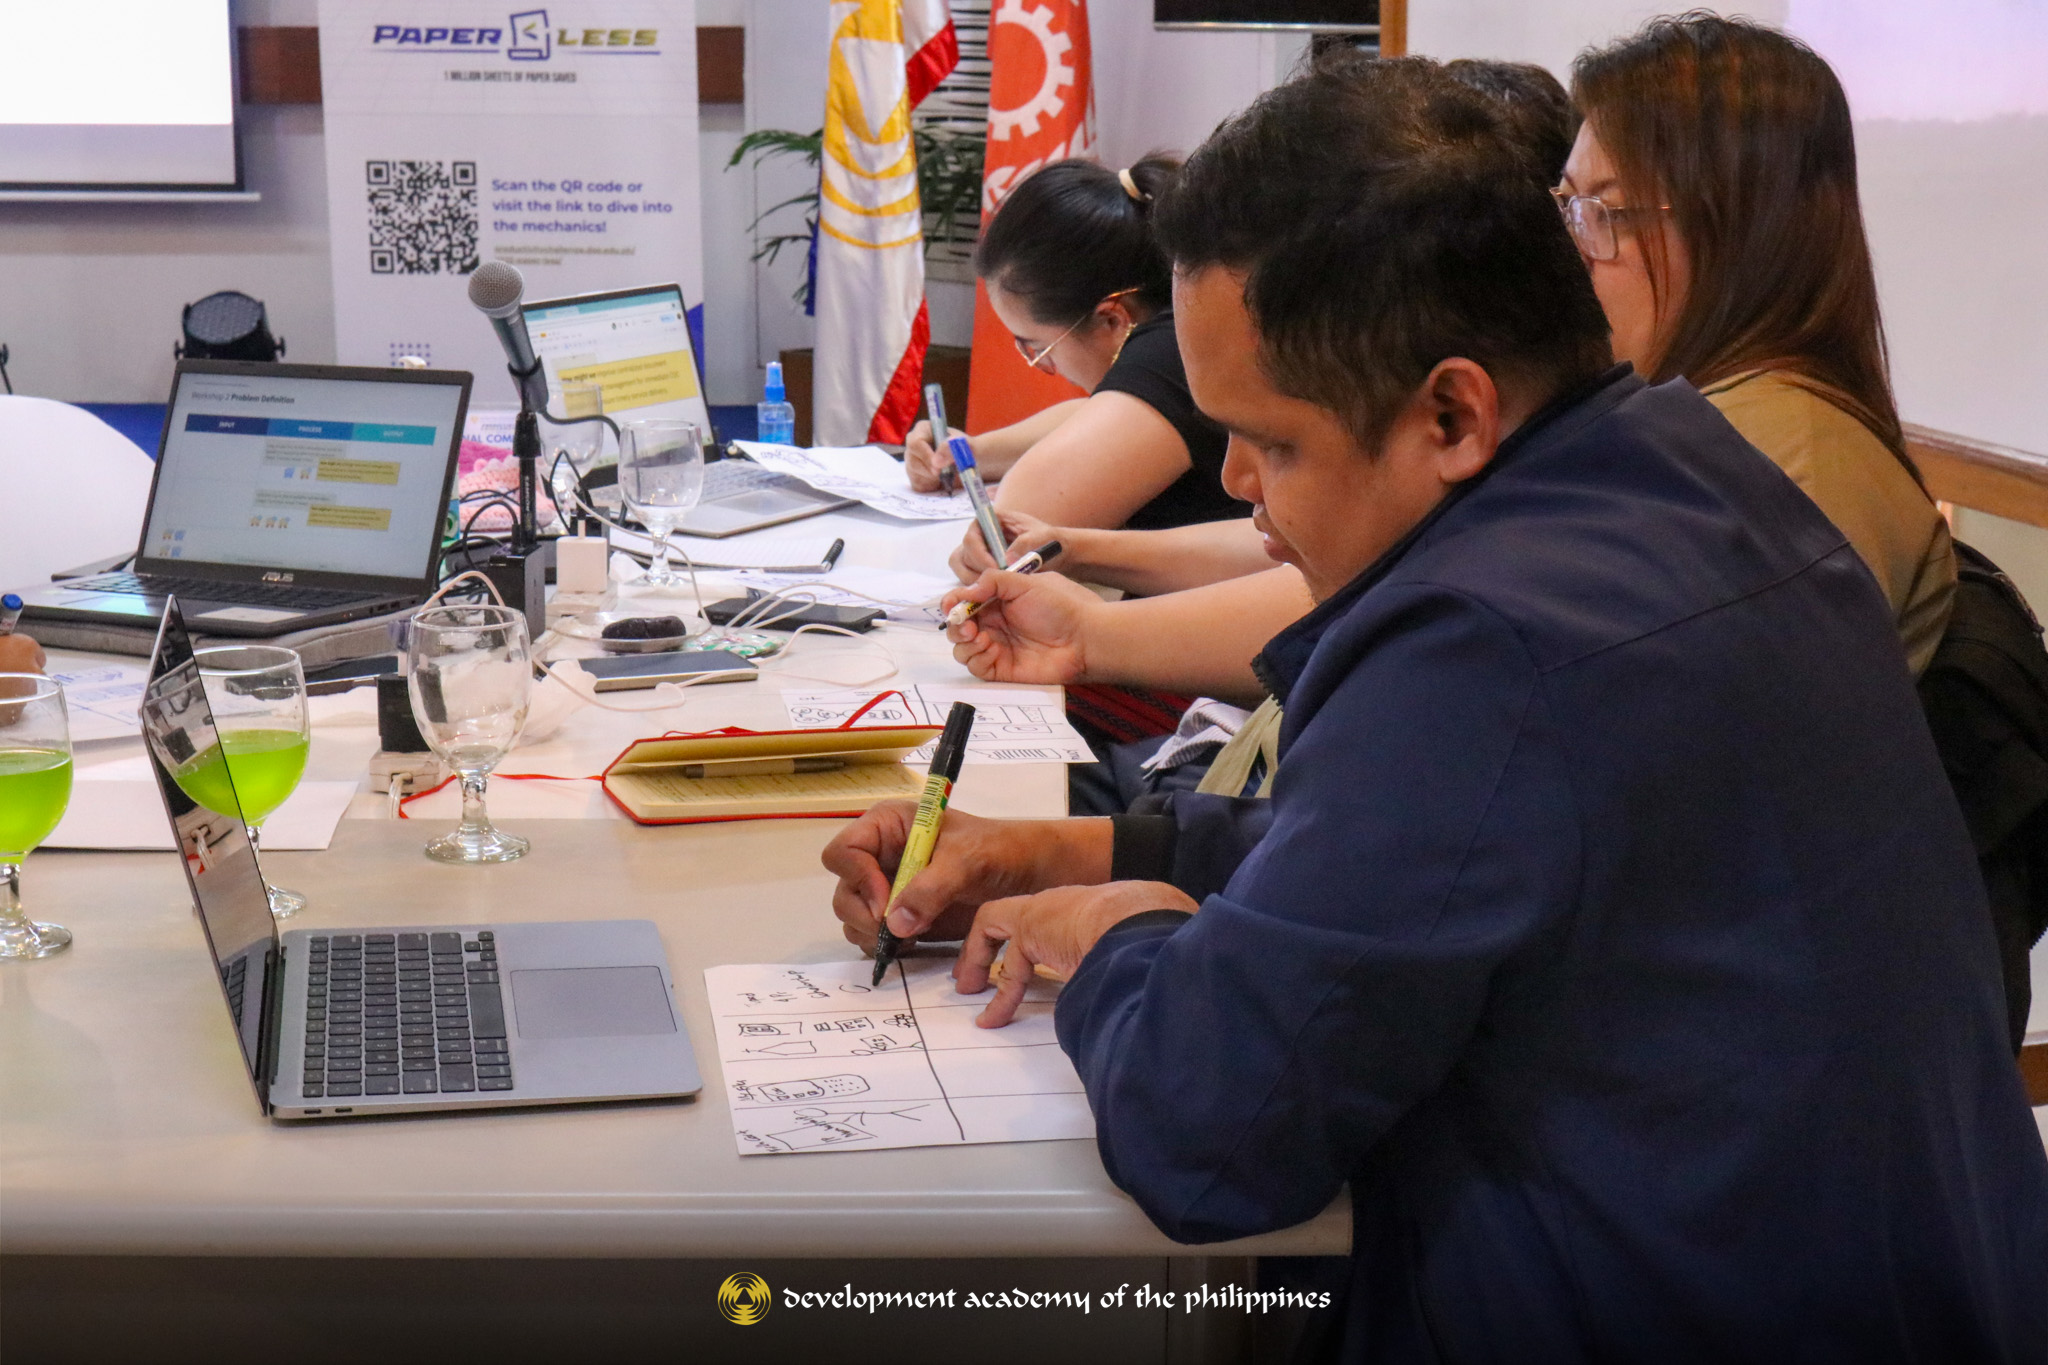
The Development Academy of the Philippines (DAP), as the focal organization of the Asian Productivity Organization’s Center of Excellence on Public-Sector Productivity, conducted the second batch of the 2025 Productivity Challenge Workshop Series on April 2, 2025, at the DAP Building in Pasig City.
A total of 28 participants from 10 government agencies took part in the workshop, which offered a hands-on learning experience on diagnosing productivity challenges and crafting innovative, context-specific solutions. Participants were guided through practical tools and approaches aimed at enhancing efficiency and service delivery in the public sector.
Discover more about the Productivity Challenge and explore its exciting campaigns:
The article is originally posted on: https://dap.edu.ph/dap-holds-second-leg-of-the-2025-productivity-challenge-workshop-series/
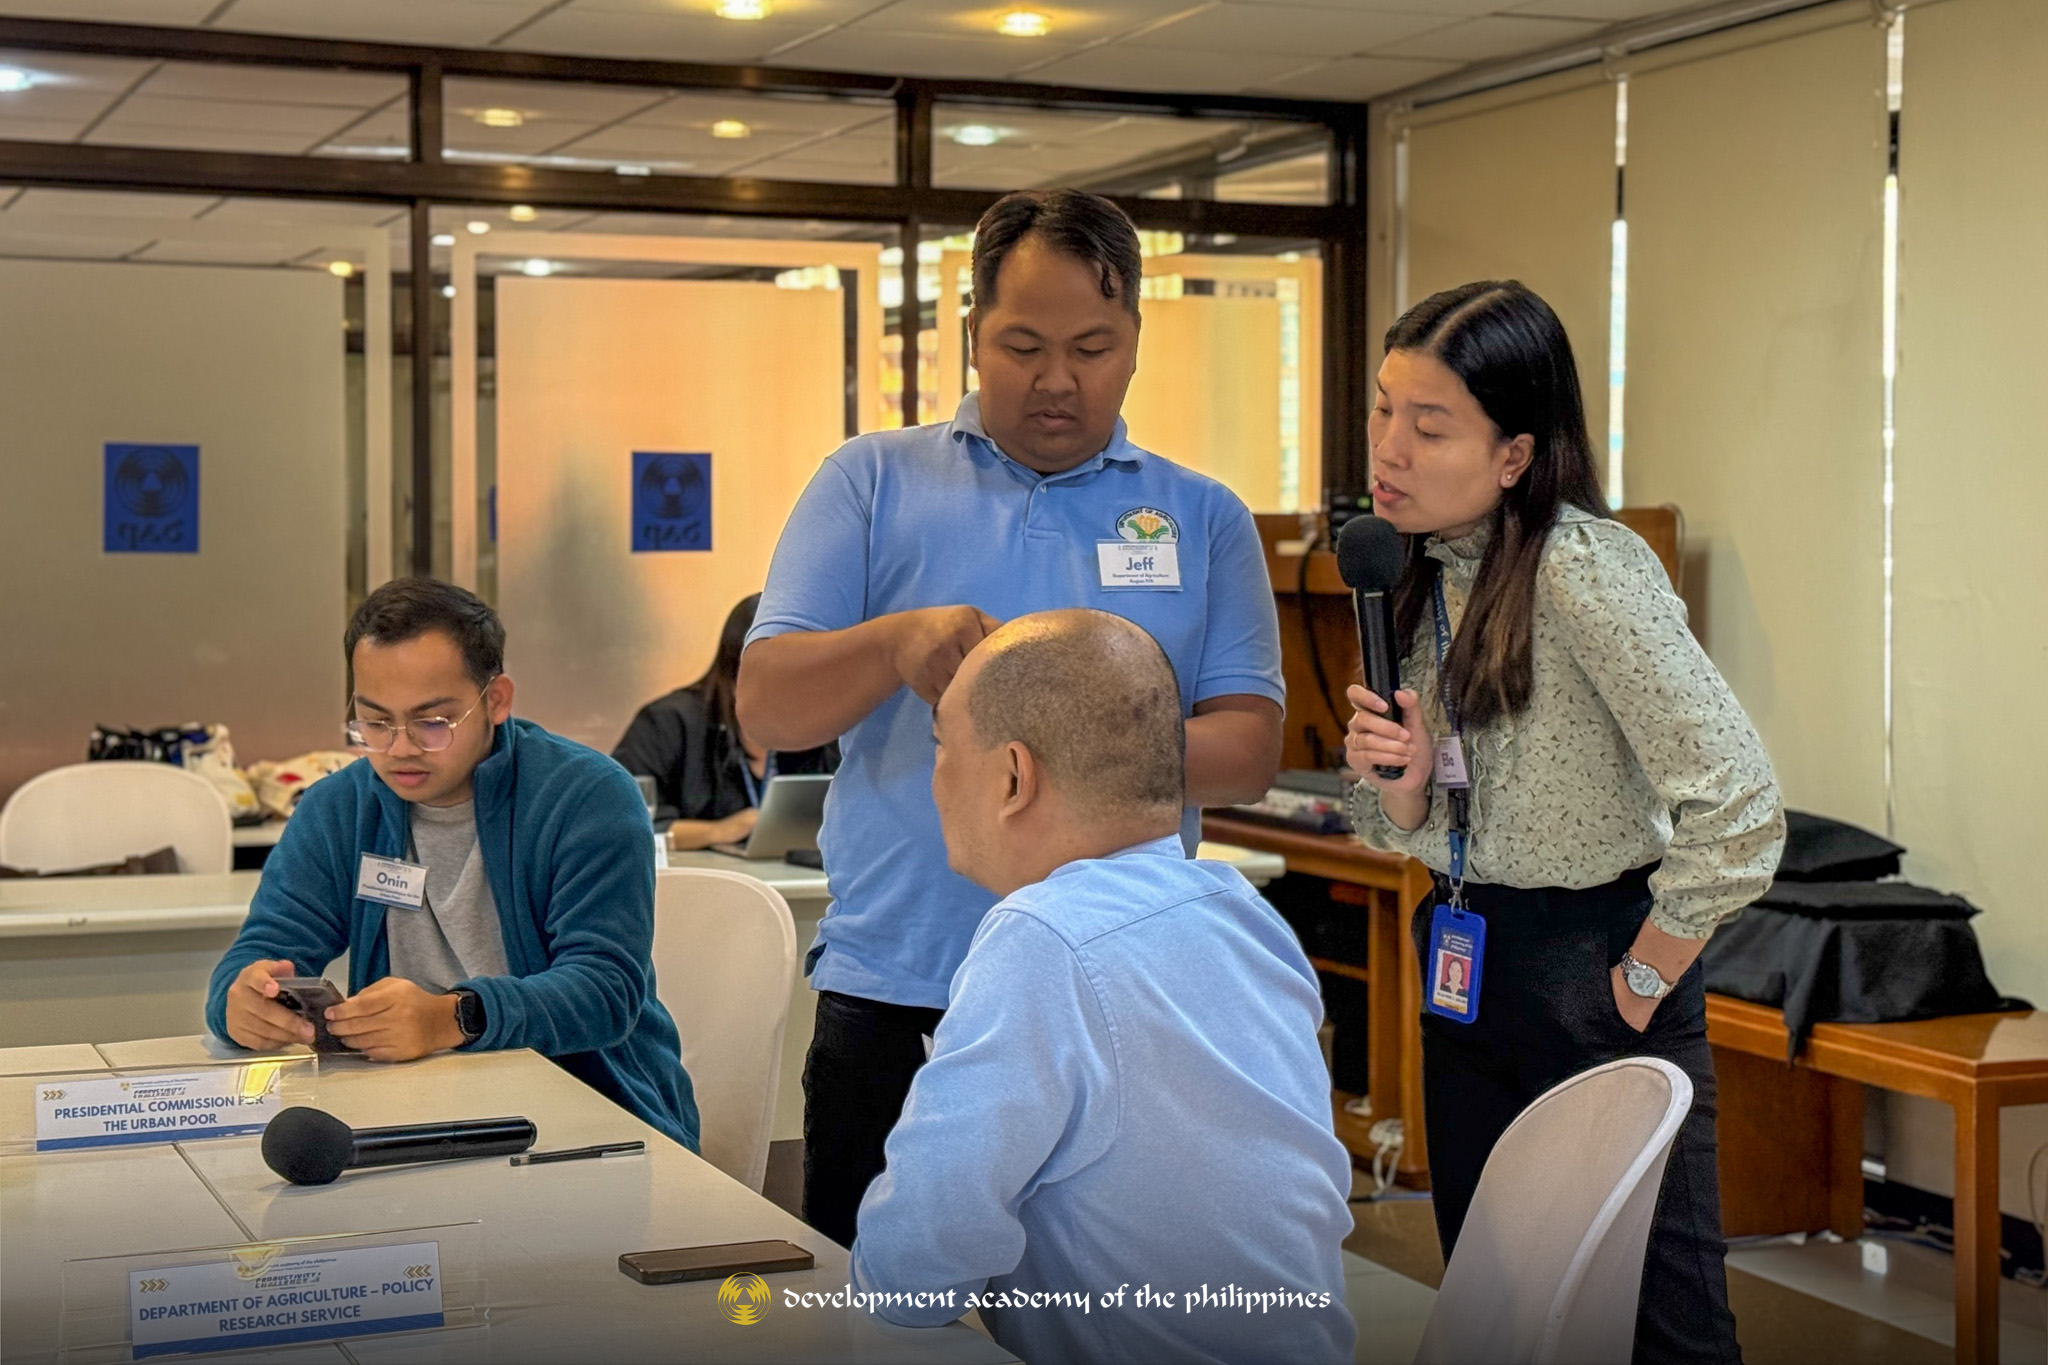
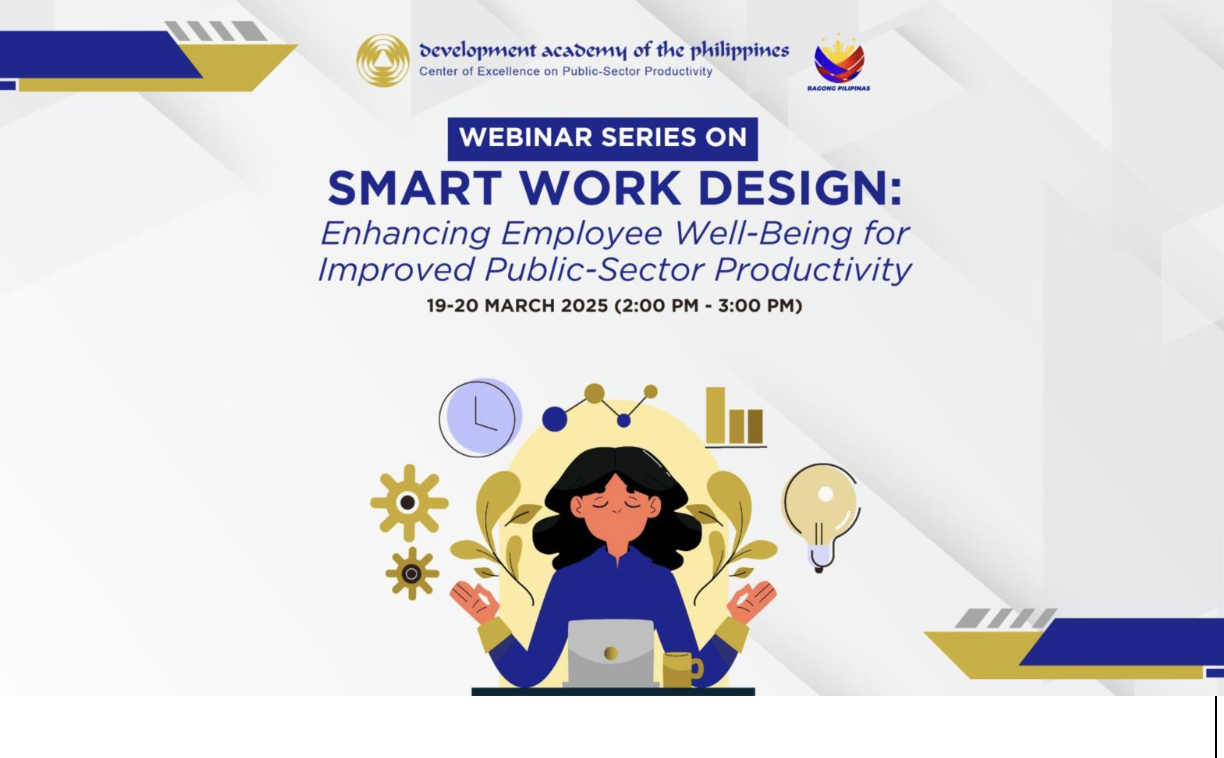
The Development Academy of the Philippines (DAP), as the Asian Productivity Organization (APO) Center of Excellence on Public Sector Productivity, held a two-day webinar titled “SMART Work Design: Enhancing Employee Well-being for Improved Public-Sector Productivity” on March 19-20, 2025. The event, which drew over 1,200 participants, focused on innovative human resources practices to tackle evolving public sector challenges.
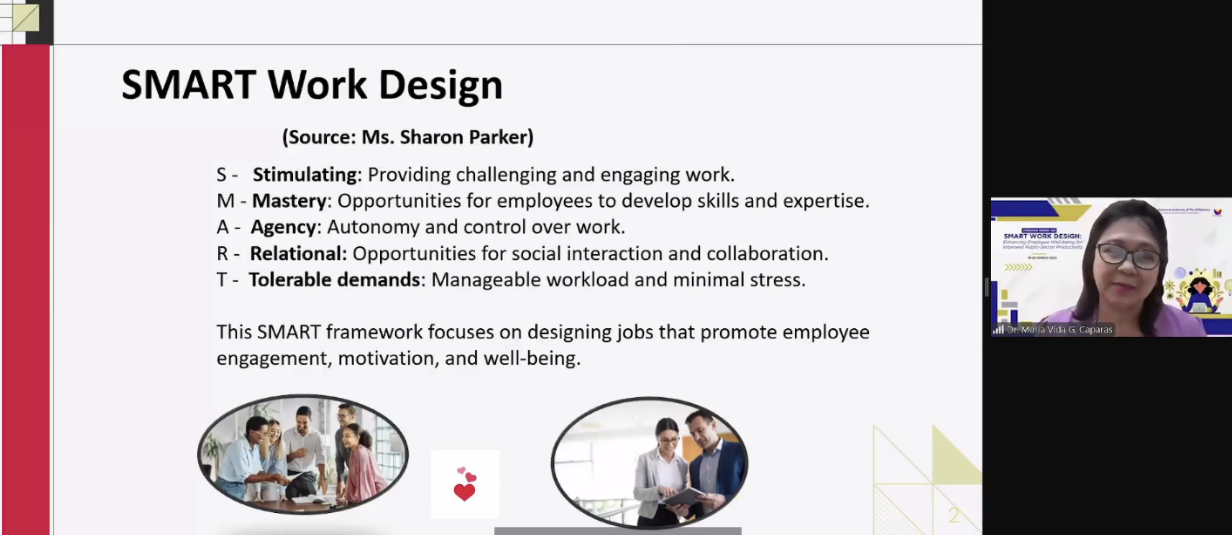
On the first day, Dr. Maria Vida Caparas, Human Resources Director at the Senate of the Philippines, introduced the SMART Work Design framework. She connected it to Hackman and Oldham’s Job Characteristics Model, illustrating how it strengthens employee engagement, motivation, and job satisfaction. Dr. Caparas shared practical approaches like job enrichment, rotation, and expansion to combat workplace issues such as disengagement and quiet quitting.
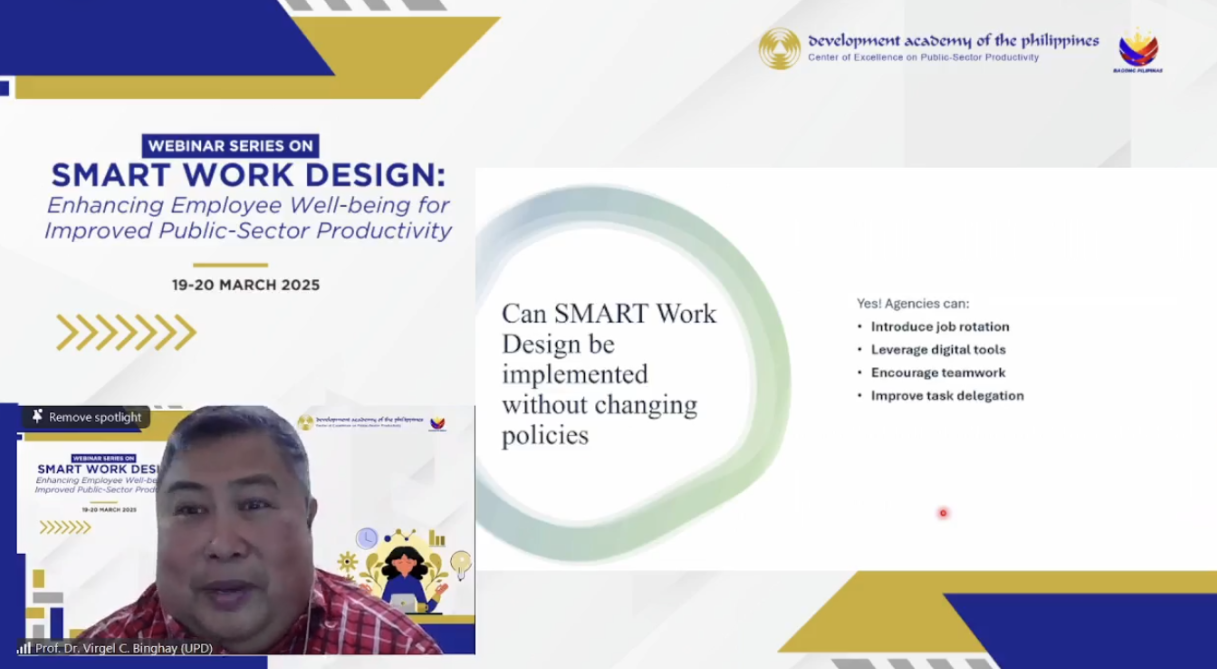
The second day featured Dr. Virgel Binghay, Professor and Director at the University of the Philippines’ Center for Industry Productivity and Competitiveness, School of Labor and Industrial Relations. He demonstrated how the application of the SMART Work Design can drive efficiency, autonomy, and meaningful work in government settings. Addressing barriers like bureaucratic resistance and resource limitations, Dr. Binghay recommended leadership support, data-driven advocacy, and incremental implementation. He also stressed the importance of process reorganization, cross-functional collaboration, and technology adaptation to drive innovation and improve public sector productivity.
The webinar equipped participants with strategies to boost employee well-being and organizational performance through SMART Work Design, underscoring DAP’s ongoing mission to cultivate innovation and productivity across the public sector.
The article is originally posted on : https://dap.edu.ph/dap-holds-webinar-on-smart-work-design-for-public-sector-productivity/