About the Tool
Purpose: Productivity Measurement
The cause-and-effect diagram developed by Dr. Kaoru Ishikawa is a simple graphical method of showing the causes of any given problem. Sometimes referred to as an Ishikawa diagram or fishbone diagram, it resembles a fish’s skeleton with a fish head. The branches representing the fishbones extending to the left and right are the reasons behind its popular fishbone name. It is one of the most effective tools for problem-solving and quality improvement. All brainstormed causes are grouped according to rational categories and subcategories. These show the relationship of the data in each category and its subcategories. A good cause-and-effect diagram has many ‘bones.’
The cause-and-effect diagram can be used in product design, quality defect prevention, and other situations requiring a deeper understanding of the root cause. This organized approach enables a comprehensive understanding of the detailed factors affecting a specific performance or outcome, making it a valuable asset in various industries and applications. The obtained information is used to prioritize areas that need improvement.
How to Use the Tool
Estimated Time Needed: 1 hr
Target Participants or Users: Process Owners, Planning Officers, Quality Control Inspectors, Project Managers
Steps
- Identify the problem. Write it at the head of the fish.
- Identify the factors that may be part of the problem: people, materials, methods, measurement, environmental factors, and policies and procedures.
- Brainstorm further possible causes for each of the factors using the 5 Whys.
- Analyze the root cause of each factor.
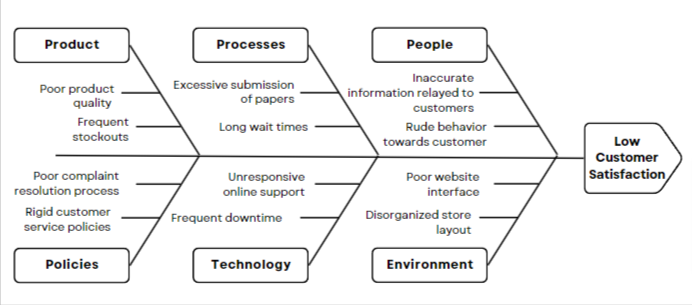
Sample Cause and Effect Diagram