About the Tool
Purpose: Productivity Measurement
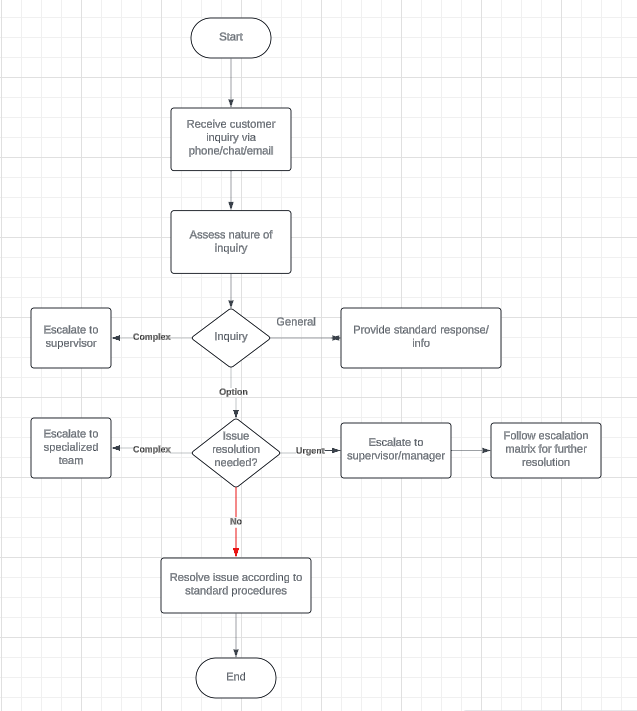
A flowchart is a graphical representation of a process that outlines the necessary steps and decisions to achieve a specific outcome. Each step in the process is represented by a diagram shape, connected by lines and arrows that guide the viewer through the sequence. This visual representation enables anyone to understand and follow the process from start to finish quickly. A flowchart is a valuable business tool that, when designed and constructed effectively, can convey the steps involved in a process clearly and concisely, streamlining communication and increasing efficiency.
Flowcharts are essential in various industries, such as production, day-to-day operations, sales, and software development. They help streamline processes, improve communication, and identify defects. In production, they illustrate product development, manufacturing, quality assurance, and maintenance, while in day-to-day operations, they automate workflows and improve productivity. In sales and marketing, they visually represent project approaches, strategies, and communication plans. Moreover, flowcharts aid developers in visualizing complex information and making informed decisions.
How to Use the Tool
Estimated Time Needed: 1.5 hrs
Target Participants or Users: Process Owners, Planning Officers, Quality Control Assessors/Evaluators, Project Managers
Steps
- Define the start, end, and process or system to be represented in the flowchart.
- Familiarize yourself with the different symbols used to make a flowchart, such as the start, end, process, decision, loops, and connectors.
- Determine the flow direction if it is top-down or left-right direction.
- Organize the steps or information in the correct order. Begin with the start symbol and connect with the process flow.
- Add connectors such as lines and arrows to show the direction or flow of the steps or information. Include loops if a process flows back to the previous steps to demonstrate repetition or cycle.
- Review the flowchart for flaws or errors and revise based on the feedback.
Sample Flow Chart

